<?xml version="1.0" encoding="utf-8"?><feed xmlns="http://www.w3.org/2005/Atom" ><generator uri="https://jekyllrb.com/" version="4.4.1">Jekyll</generator><link href="https://www.mertl-research.at/feed.xml" rel="self" type="application/atom+xml" /><link href="https://www.mertl-research.at/" rel="alternate" type="text/html" /><updated>2025-12-11T16:49:06+01:00</updated><id>https://www.mertl-research.at/feed.xml</id><title type="html">Mertl Research</title><subtitle>Mertl Research GbmH is an engineering consultants company (member of the Austrian Association of Consulting Engineer) providing services in seismic monitoring and geoscience software development with a focus on free software, openess and trasparency.</subtitle><author><name>stefan</name></author><entry xml:lang="de"><title type="html">MSS Jahresbericht 2022</title><link href="https://www.mertl-research.at/jahresbericht_2022/" rel="alternate" type="text/html" title="MSS Jahresbericht 2022" /><published>2023-03-30T00:00:00+02:00</published><updated>2023-03-30T00:00:00+02:00</updated><id>https://www.mertl-research.at/jahresbericht_2022</id><content type="html" xml:base="https://www.mertl-research.at/jahresbericht_2022/"><![CDATA[<p>Der MSS Jahresbericht steht auf der <a href="https://www.macroseismicsensor.at" target="blank">MSS Homepage</a> als Download im PDF Format zu Verfügung: <a href="https://www.macroseismicsensor.at/assets/doc/reports/bericht_202303-01_1-0_mss-2022.pdf">MSS Jahresbericht 2022</a>.</p>

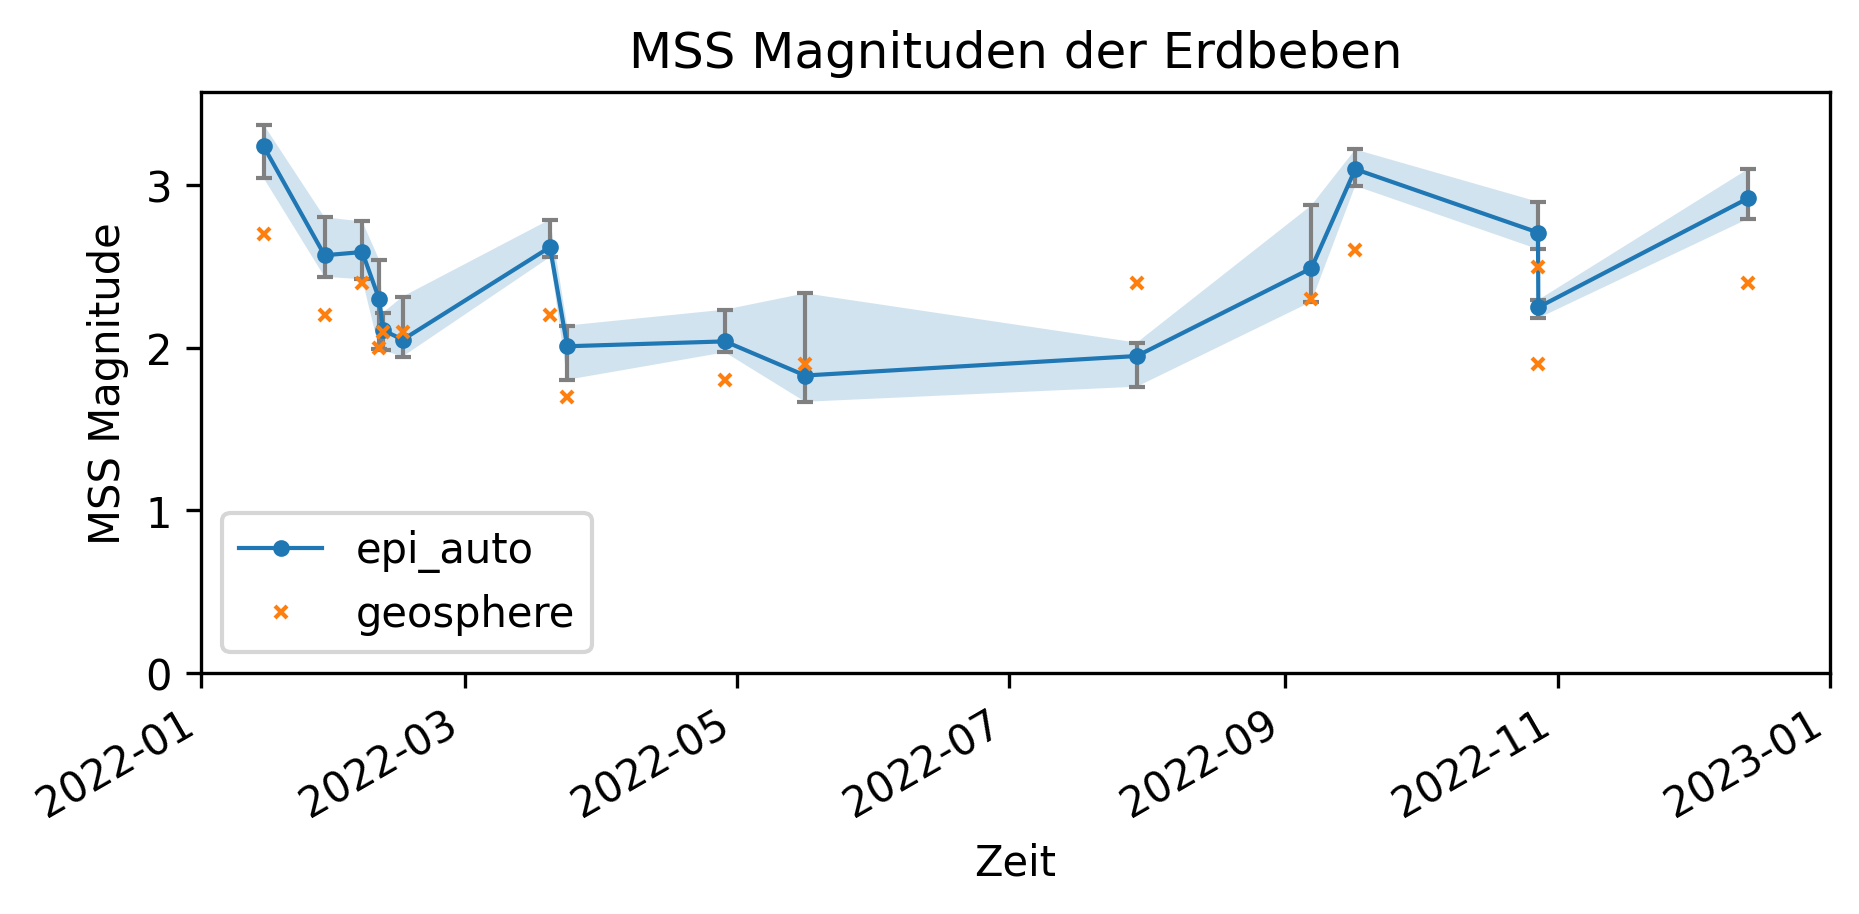
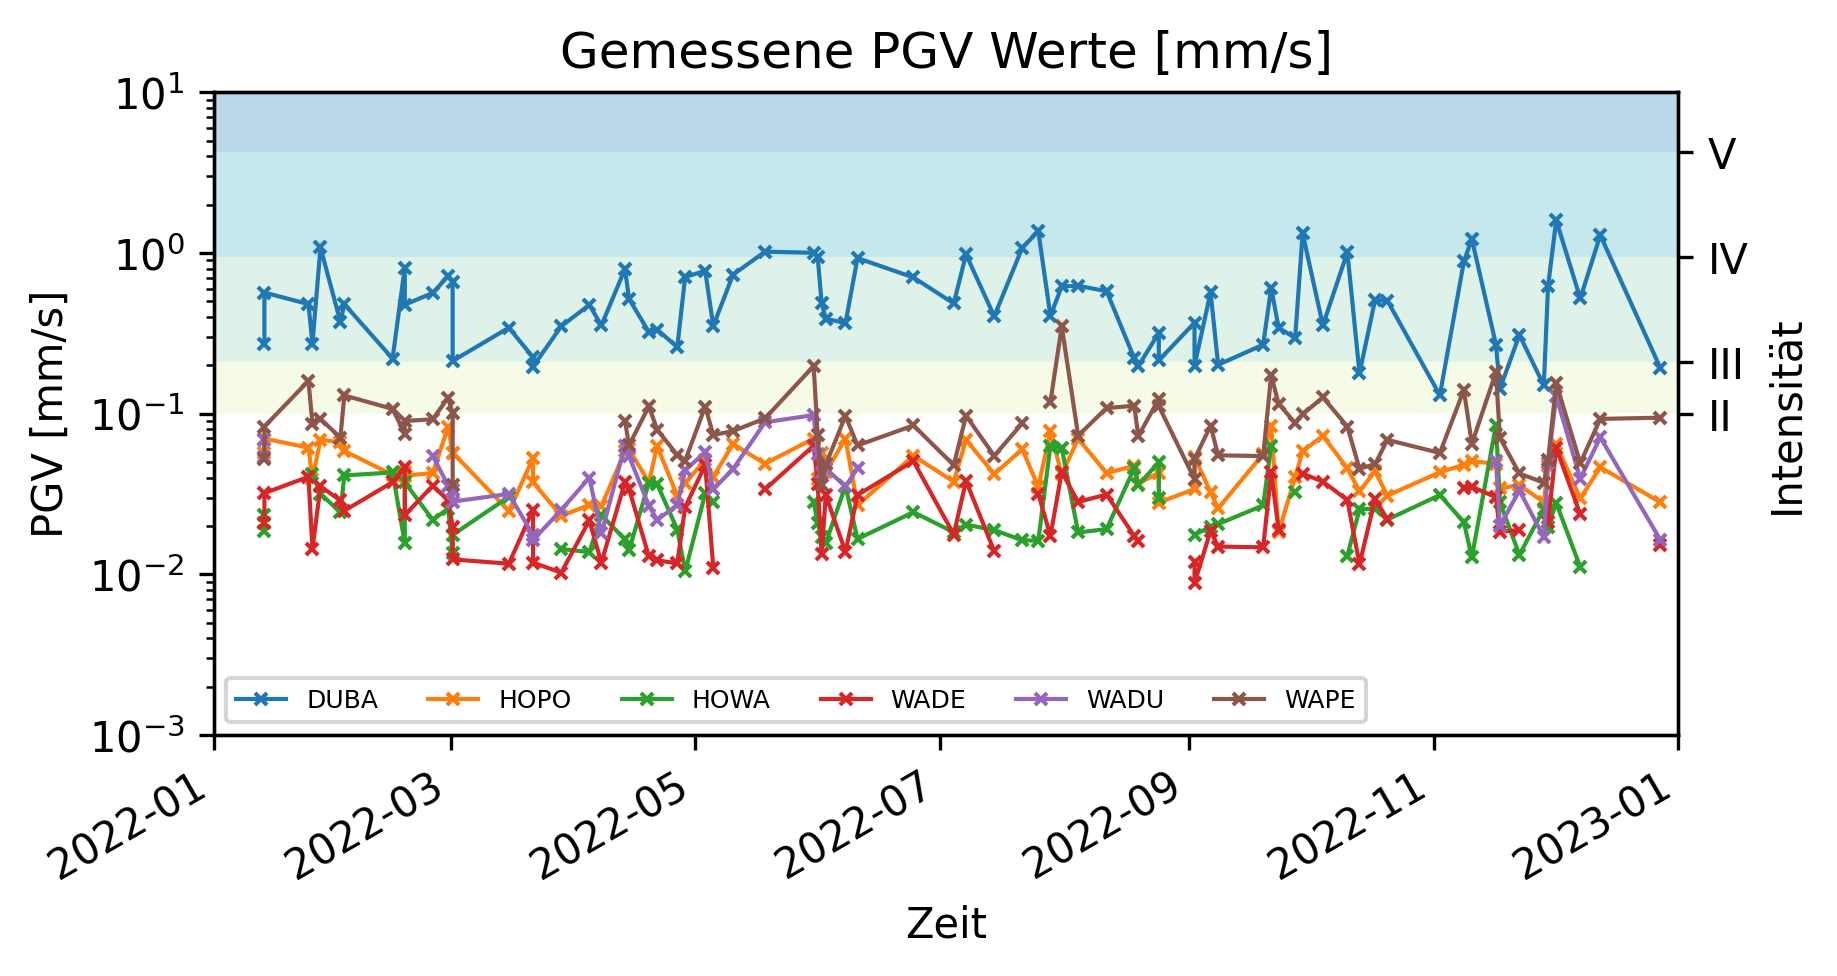
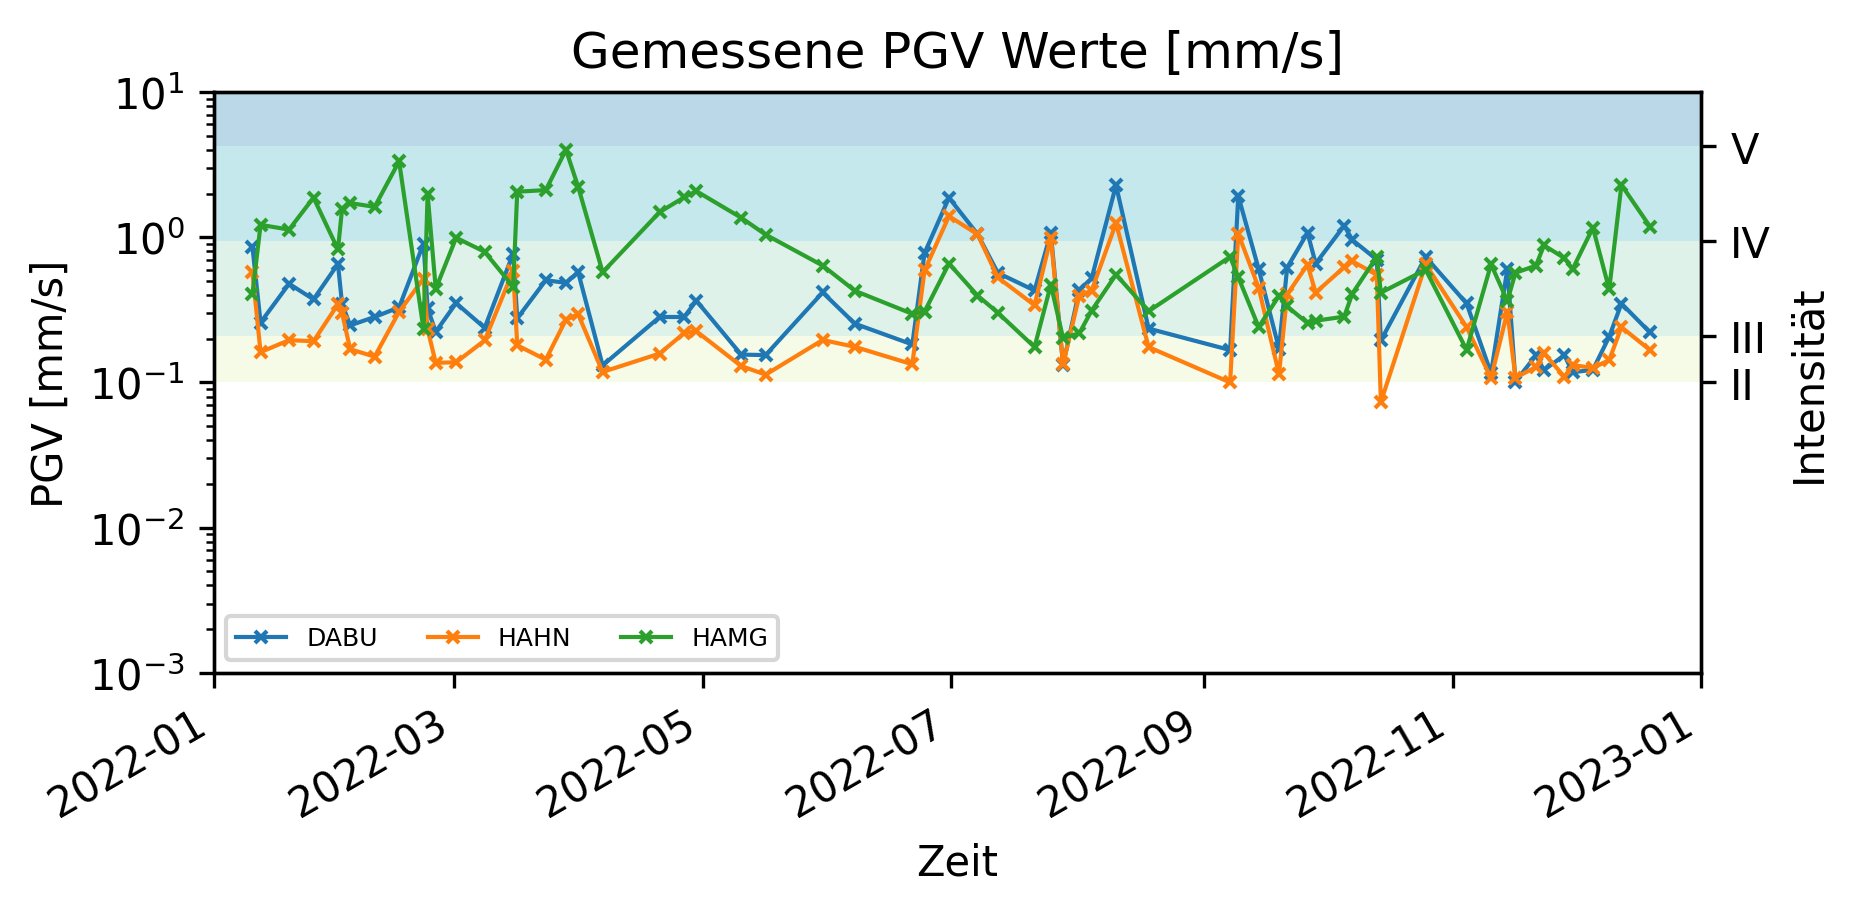
<p>Im Jahr 2022 wurden 16 potentiell fühlbare Erdbeben innerhalb des Bereichs des MSS Netzwerks registriert. Des weiteren wurden 76 Sprengungen im Steinbruch Dürnbach, sowie 63 Sprengungen im Steinbruch Pfaffenberg detektiert und ausgewertet. Abbildung 1 zeigt die MSS Magnituden der detektierten Erdbeben. In Abbildung 2 und 3 sind die gemessenen PGV Werte für die Sprengungen im Steinbruch Dürnbach und Pfaffenberg dargestellt.</p>

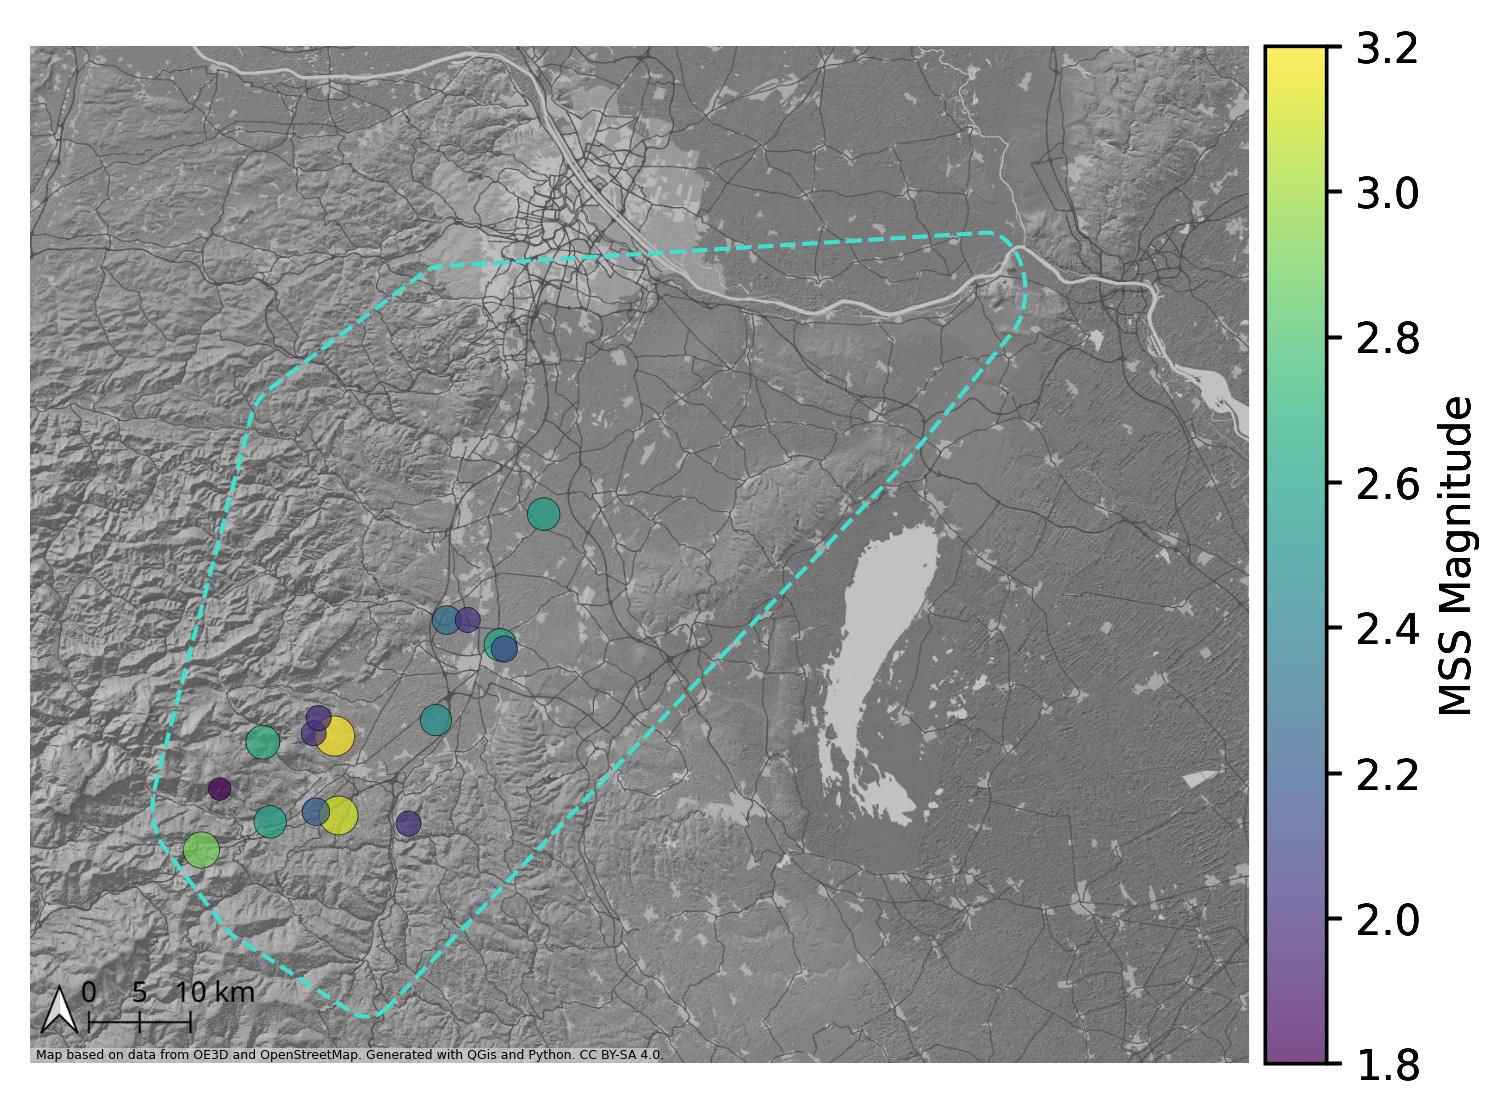
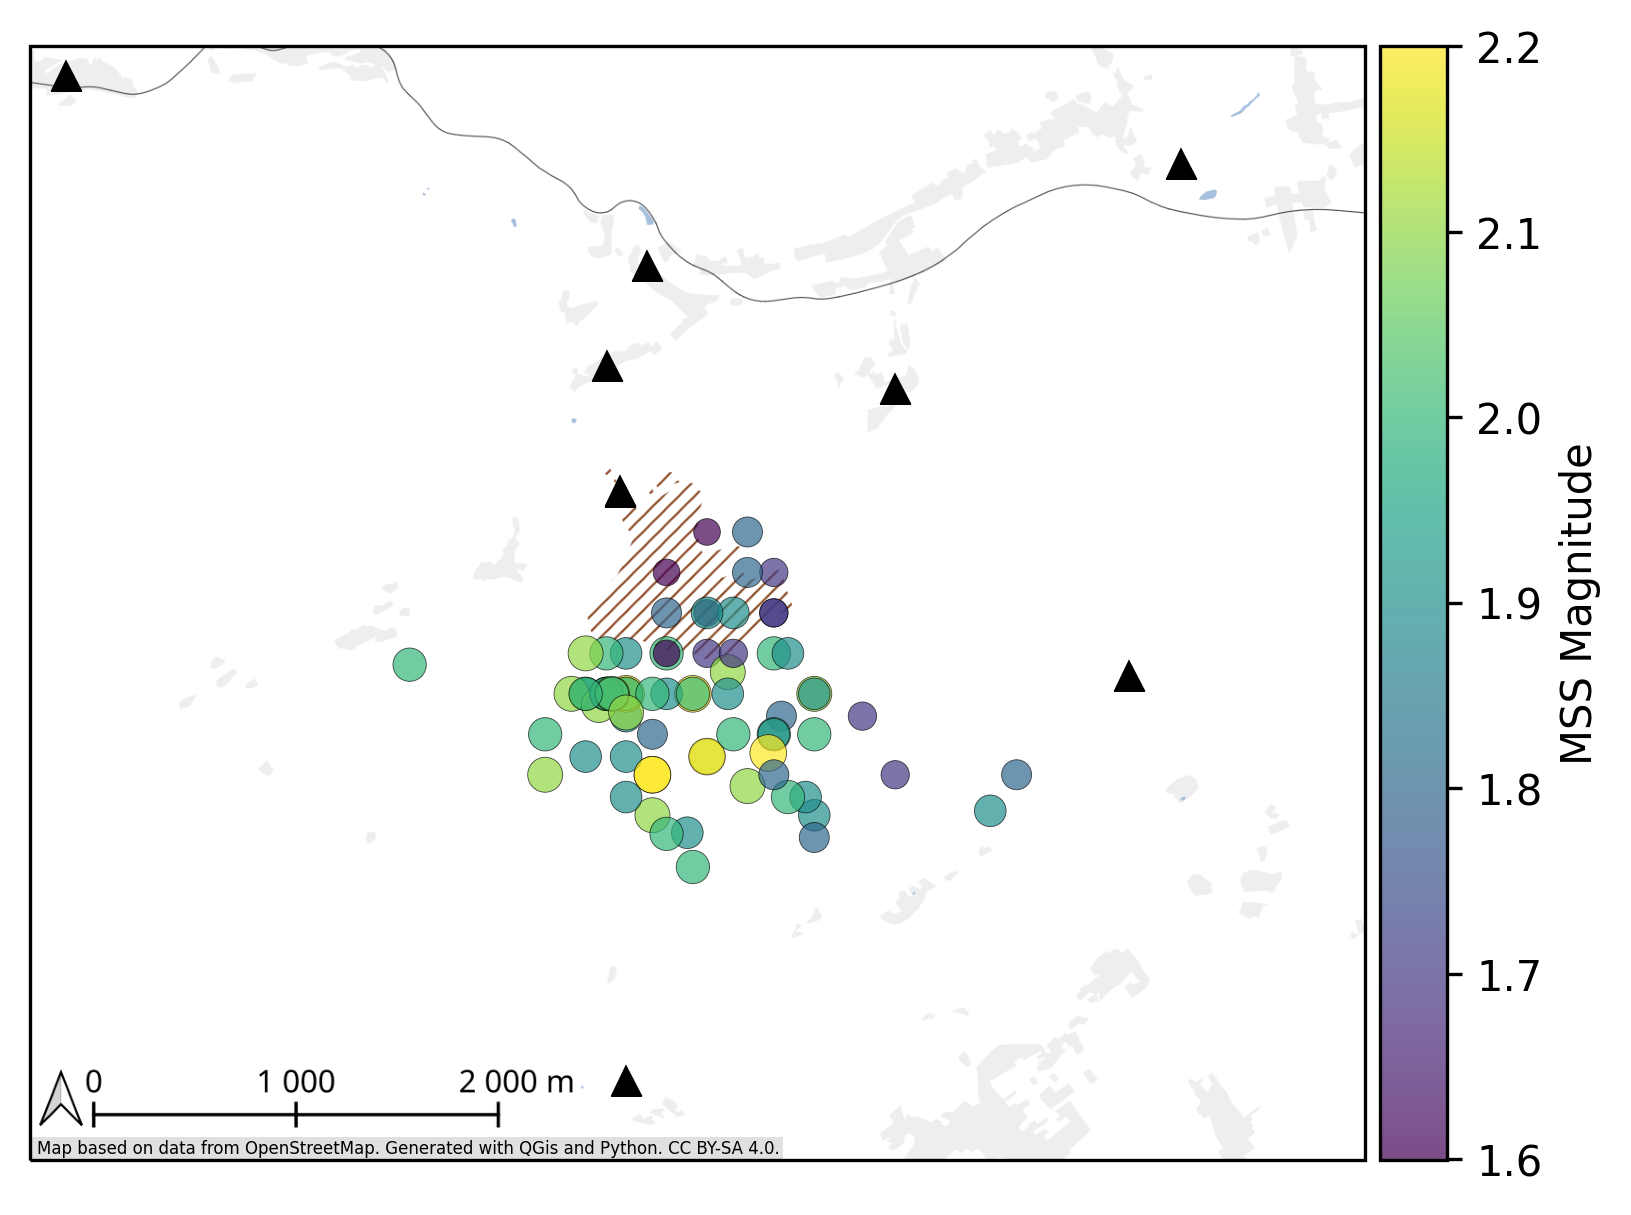
<p>Im Jahr 2022 wurde die Archivdarstellung des MSS Katalogs stark erweitert sowie eine automatische Lokalisierung und Magnitudenberechnung implementiert. In Abbildung 4 und 5 sind die berechneten Epizentren der Erdbeben und der Sprengungen im Steinbruch Dürnbach dargestellt.</p>

<p>Details zu den Messdaten und Auswertemethoden sind im  <a href="https://www.macroseismicsensor.at/assets/doc/reports/bericht_202303-01_1-0_mss-2022.pdf">MSS Jahresbericht 2022</a> beschrieben.</p>

<div class="image-container">
    <a href="/images/posts/2023/01_mss_jahresbericht_2022/earthquakes_mss_magnitudes_with_errorbar.png" data-featherlight="image" caption="MSS Magnitude (epi-auto) der Erdbeben mit Schwankungsbreite und die von Geosphere Austria bestimmten Magnituden (geosphere). Die Schwankungsbreite ist der Interquartilsabstand der Stationsmagnituden" id="fig:earthquakes-magnitudes">
        <img src="/images/posts/2023/01_mss_jahresbericht_2022/earthquakes_mss_magnitudes_with_errorbar.png" alt="MSS Magnitude (epi-auto) der Erdbeben mit Schwankungsbreite und die von Geosphere Austria bestimmten Magnituden (geosphere). Die Schwankungsbreite ist der Interquartilsabstand der Stationsmagnituden" />
    </a>


        <figcaption class="lang_de">
            MSS Magnitude (epi-auto) der Erdbeben mit Schwankungsbreite und die von Geosphere Austria bestimmten Magnituden (geosphere). Die Schwankungsbreite ist der Interquartilsabstand der Stationsmagnituden
 
        </figcaption>
    
    
</div>

<div class="image-container">
    <a href="/images/posts/2023/01_mss_jahresbericht_2022/blasts_duernbach_pgv_linechart.png" data-featherlight="image" caption="Gemessene PGV Werte an Stationen des MSS Netzwerks in der Nähe des Steinbruchs Dürnbach." id="fig:blasts-duernbach">
        <img src="/images/posts/2023/01_mss_jahresbericht_2022/blasts_duernbach_pgv_linechart.png" alt="Gemessene PGV Werte an Stationen des MSS Netzwerks in der Nähe des Steinbruchs Dürnbach." />
    </a>


        <figcaption class="lang_de">
            Gemessene PGV Werte an Stationen des MSS Netzwerks in der Nähe des Steinbruchs Dürnbach.
 
        </figcaption>
    
    
</div>

<div class="image-container">
    <a href="/images/posts/2023/01_mss_jahresbericht_2022/blasts_pfaffenberg_pgv_linechart.png" data-featherlight="image" caption="Gemessene PGV Werte an Stationen des MSS Netzwerks in der Nähe des Steinbruchs Pfaffenberg." id="fig:blasts-pfaffenberg">
        <img src="/images/posts/2023/01_mss_jahresbericht_2022/blasts_pfaffenberg_pgv_linechart.png" alt="Gemessene PGV Werte an Stationen des MSS Netzwerks in der Nähe des Steinbruchs Pfaffenberg." />
    </a>


        <figcaption class="lang_de">
            Gemessene PGV Werte an Stationen des MSS Netzwerks in der Nähe des Steinbruchs Pfaffenberg.
 
        </figcaption>
    
    
</div>

<div class="image-container">
    <a href="/images/posts/2023/01_mss_jahresbericht_2022/earthquakes_epicenters_with_auto_mag.jpg" data-featherlight="image" caption="Automatisch berechnete Epizentren und MSS Magnituden der detektierten Erdbeben." id="fig:earthquakes-epicenters">
        <img src="/images/posts/2023/01_mss_jahresbericht_2022/earthquakes_epicenters_with_auto_mag.jpg" alt="Automatisch berechnete Epizentren und MSS Magnituden der detektierten Erdbeben." />
    </a>


        <figcaption class="lang_de">
            Automatisch berechnete Epizentren und MSS Magnituden der detektierten Erdbeben.
 
        </figcaption>
    
    
</div>

<div class="image-container">
    <a href="/images/posts/2023/01_mss_jahresbericht_2022/blasts_duernbach_epicenters_with_auto_mag.png" data-featherlight="image" caption="Automatisch berechnete Epizentren der Sprengungen im Steinbruch Dürnbach." id="fig:duernbach-epicenters">
        <img src="/images/posts/2023/01_mss_jahresbericht_2022/blasts_duernbach_epicenters_with_auto_mag.png" alt="Automatisch berechnete Epizentren der Sprengungen im Steinbruch Dürnbach." />
    </a>


        <figcaption class="lang_de">
            Automatisch berechnete Epizentren der Sprengungen im Steinbruch Dürnbach.
 
        </figcaption>
    
    
</div>]]></content><author><name>Stefan Mertl</name></author><summary type="html"><![CDATA[Der MSS Jahresbericht steht auf der MSS Homepage als Download im PDF Format zu Verfügung: MSS Jahresbericht 2022. Im Jahr 2022 wurden 16 potentiell fühlbare Erdbeben innerhalb des Bereichs des MSS Netzwerks registriert. Des weiteren wurden 76 Sprengungen im Steinbruch Dürnbach, sowie 63 Sprengungen im Steinbruch Pfaffenberg detektiert und ausgewertet. Abbildung 1 zeigt die MSS Magnituden der detektierten Erdbeben. In Abbildung 2 und 3 sind die gemessenen PGV Werte für die Sprengungen im Steinbruch Dürnbach und Pfaffenberg dargestellt. Im Jahr 2022 wurde die Archivdarstellung des MSS Katalogs stark erweitert sowie eine automatische Lokalisierung und Magnitudenberechnung implementiert. In Abbildung 4 und 5 sind die berechneten Epizentren der Erdbeben und der Sprengungen im Steinbruch Dürnbach dargestellt. Details zu den Messdaten und Auswertemethoden sind im MSS Jahresbericht 2022 beschrieben. MSS Magnitude (epi-auto) der Erdbeben mit Schwankungsbreite und die von Geosphere Austria bestimmten Magnituden (geosphere). Die Schwankungsbreite ist der Interquartilsabstand der Stationsmagnituden Gemessene PGV Werte an Stationen des MSS Netzwerks in der Nähe des Steinbruchs Dürnbach. Gemessene PGV Werte an Stationen des MSS Netzwerks in der Nähe des Steinbruchs Pfaffenberg. Automatisch berechnete Epizentren und MSS Magnituden der detektierten Erdbeben. Automatisch berechnete Epizentren der Sprengungen im Steinbruch Dürnbach.]]></summary><media:thumbnail xmlns:media="http://search.yahoo.com/mrss/" url="https://www.mertl-research.at/%7B%22homepage%22=%3E%22frontpage.jpg%22,%20%22featured%22=%3E%22frontpage.jpg%22%7D" /><media:content medium="image" url="https://www.mertl-research.at/%7B%22homepage%22=%3E%22frontpage.jpg%22,%20%22featured%22=%3E%22frontpage.jpg%22%7D" xmlns:media="http://search.yahoo.com/mrss/" /></entry><entry xml:lang="de"><title type="html">Neue Publikationen</title><link href="https://www.mertl-research.at/publikationen/" rel="alternate" type="text/html" title="Neue Publikationen" /><published>2022-08-15T00:00:00+02:00</published><updated>2022-08-15T00:00:00+02:00</updated><id>https://www.mertl-research.at/publikationen</id><content type="html" xml:base="https://www.mertl-research.at/publikationen/"><![CDATA[<p>Ich konnte als Co-Autor einige Inhalte zu spannenden Veröffentlichungen beitragen.</p>

<h2 id="mss-netzwerk">MSS Netzwerk</h2>
<p>Im Open Access Kapitel “<a href="https://www.intechopen.com/chapters/74466">Seismological Data Acquisition and Analysis within the Scope of Citizen Science</a>” <a class="citation" href="#bruckl_seismological_2021">[1]</a> im Buch “<a href="https://www.intechopen.com/books/9993" target="blank">Earthquakes</a>” beschreiben wir die Methoden bei der Auswertung und Visualisierung der Daten des <a href="https://www.macroseismicsensor.at" target="blank">MSS Netzwerks</a>.</p>

<p>Die Vorstellung des MSS Netzwerks in deutscher Sprache ist im Artikel “Das Macroseismic Sensor Projekt” <a class="citation" href="#bruckl_macroseismic_2021">[2]</a> im Journal “Österreichische Zeitschrift für Vermessung &amp; Geoinformation” erschienen. Dieser Artikel ist leider noch nicht online frei verfügbar.</p>

<h2 id="massenbewegung-in-grönland">Massenbewegung in Grönland</h2>
<p>Ich bin im Rahmen des Projekts “<a href="https://www.geocenter.dk/projekter/2020-2/now-noise-of-thaw/" target="blank">NOW - NOise of thaW</a>” des <a href="https://eng.geus.dk/" target="blank">Geological Survey of Denmark and Greenland</a> an der Instrumentierung und Datenauswertung von seismischen Monitoring Stationen in Grönland beteiligt. Im Juni 2021 fand eine Massenbewegung in Assapaat in West-Grönland statt. Ein Studienort des NOW Projekts lag in ca. 10 km Entfernung zu dieser Massenbewegung. Im Artikel “<a href="https://link.springer.com/article/10.1007/s10346-022-01922-7" target="blank">A large frozen debris avalanche entraining warming permafrost ground—the June 2021 Assapaat landslide, West Greenland</a>” <a class="citation" href="#svennevig_large_2022">[3]</a> wird die Massenbewegung detailliert beschrieben. Erstaunlicherweise konnte auf den seismischen Stationen des NOW Projekts und des regionalen grönländischen seismischen Netzwerks nur sehr schwache Signale der Massenbewegung zugeordnet werden.</p>

<h2 id="referenzen">Referenzen</h2>
<ul class="bibliography"><li><div class="text-justify"><span id="svennevig_large_2022">K. Svennevig <i>et al.</i>, “A large frozen debris avalanche entraining warming permafrost ground—the June 2021 Assapaat landslide, West Greenland,” <i>Landslides</i>, July 2022.</span></div>

<a href="http://doi.org/10.1007/s10346-022-01922-7" target="_blank">http://doi.org/10.1007/s10346-022-01922-7</a>


<a href="https://doi.org/10.1007/s10346-022-01922-7">https://doi.org/10.1007/s10346-022-01922-7</a><br />


<a id="asvennevig_large_2022" style="display: none;">
<pre>@article{svennevig_large_2022,
  title = {A large frozen debris avalanche entraining warming permafrost ground—the {June} 2021 {Assapaat} landslide, {West} {Greenland}},
  issn = {1612-5118},
  url = {https://doi.org/10.1007/s10346-022-01922-7},
  doi = {10.1007/s10346-022-01922-7},
  language = {en},
  urldate = {2022-08-15},
  journal = {Landslides},
  author = {Svennevig, Kristian and Hermanns, Reginald L. and Keiding, Marie and Binder, Daniel and Citterio, Michele and Dahl-Jensen, Trine and Mertl, Stefan and Sørensen, Erik Vest and Voss, Peter H.},
  month = jul,
  year = {2022},
  keywords = {Assapaat landslide, Global warming, Slope temperature},
  file = {svennevig_et_al_2022_a_large_frozen_debris_avalanche_entraining_warming_permafrost_ground—the_june.pdf:/home/stefan/01_gtd/05_dokumente/bibliothek/zotero/storage/646U8A6Q/svennevig_et_al_2022_a_large_frozen_debris_avalanche_entraining_warming_permafrost_ground—the_june.pdf:application/pdf}
}
</pre>
</a>
<script>
function toggleBibtexsvennevig_large_2022(parameter) {
    var x= document.getElementById('asvennevig_large_2022');
    if (x.style.display === 'none') {
        x.style.display = 'block';
    } else {
        x.style.display = 'none';
    }
}
</script>
</li>
<li><div class="text-justify"><span id="bruckl_seismological_2021">E. Brückl, P. Carniel, S. Mertl, and R. Meurers, “Seismological Data Acquisition and Analysis within the Scope of Citizen Science,” in <i>Earthquakes</i>, IntechOpen, 2021.</span></div>

<a href="http://doi.org/10.5772/intechopen.95273" target="_blank">http://doi.org/10.5772/intechopen.95273</a>


<a href="https://www.intechopen.com/chapters/74466">https://www.intechopen.com/chapters/74466</a><br />


<a id="abruckl_seismological_2021" style="display: none;">
<pre>@incollection{bruckl_seismological_2021,
  title = {Seismological {Data} {Acquisition} and {Analysis} within the {Scope} of {Citizen} {Science}},
  url = {https://www.intechopen.com/chapters/74466},
  language = {en},
  urldate = {2021-04-07},
  booktitle = {Earthquakes},
  publisher = {IntechOpen},
  author = {Brückl, Ewald and Carniel, Peter and Mertl, Stefan and Meurers, Rita},
  month = jan,
  year = {2021},
  doi = {10.5772/intechopen.95273},
  project = {macro_seismic_network},
  group = {article}
}
</pre>
</a>
<script>
function toggleBibtexbruckl_seismological_2021(parameter) {
    var x= document.getElementById('abruckl_seismological_2021');
    if (x.style.display === 'none') {
        x.style.display = 'block';
    } else {
        x.style.display = 'none';
    }
}
</script>
</li>
<li><div class="text-justify"><span id="bruckl_macroseismic_2021">E. Brückl, P. Carniel, S. Mertl, and R. Meurers, “Das Macroseismic Sensor Projekt,” <i>Österreichische Zeitschrift für Vermessung &amp; Geoinformation</i>, vol. 109, no. 3, pp. 114–130, 2021.</span></div>


<a href="https://www.ovg.at/de/vgi/ausgabe/1301/">https://www.ovg.at/de/vgi/ausgabe/1301/</a><br />


<a id="abruckl_macroseismic_2021" style="display: none;">
<pre>@article{bruckl_macroseismic_2021,
  title = {Das {Macroseismic} {Sensor} {Projekt}},
  url = {https://www.ovg.at/de/vgi/ausgabe/1301/},
  volume = {109},
  language = {de},
  number = {3},
  journal = {Österreichische Zeitschrift für Vermessung \&amp; Geoinformation},
  author = {Brückl, Ewald and Carniel, Peter and Mertl, Stefan and Meurers, Rita},
  year = {2021},
  pages = {114--130},
  project = {macro_seismic_network},
  group = {article}
}
</pre>
</a>
<script>
function toggleBibtexbruckl_macroseismic_2021(parameter) {
    var x= document.getElementById('abruckl_macroseismic_2021');
    if (x.style.display === 'none') {
        x.style.display = 'block';
    } else {
        x.style.display = 'none';
    }
}
</script>
</li></ul>]]></content><author><name>Stefan Mertl</name></author><summary type="html"><![CDATA[Ich konnte als Co-Autor einige Inhalte zu spannenden Veröffentlichungen beitragen. MSS Netzwerk Im Open Access Kapitel “Seismological Data Acquisition and Analysis within the Scope of Citizen Science” [3] im Buch “Earthquakes” beschreiben wir die Methoden bei der Auswertung und Visualisierung der Daten des MSS Netzwerks. Die Vorstellung des MSS Netzwerks in deutscher Sprache ist im Artikel “Das Macroseismic Sensor Projekt” [3] im Journal “Österreichische Zeitschrift für Vermessung &amp; Geoinformation” erschienen. Dieser Artikel ist leider noch nicht online frei verfügbar. Massenbewegung in Grönland Ich bin im Rahmen des Projekts “NOW - NOise of thaW” des Geological Survey of Denmark and Greenland an der Instrumentierung und Datenauswertung von seismischen Monitoring Stationen in Grönland beteiligt. Im Juni 2021 fand eine Massenbewegung in Assapaat in West-Grönland statt. Ein Studienort des NOW Projekts lag in ca. 10 km Entfernung zu dieser Massenbewegung. Im Artikel “A large frozen debris avalanche entraining warming permafrost ground—the June 2021 Assapaat landslide, West Greenland” [3] wird die Massenbewegung detailliert beschrieben. Erstaunlicherweise konnte auf den seismischen Stationen des NOW Projekts und des regionalen grönländischen seismischen Netzwerks nur sehr schwache Signale der Massenbewegung zugeordnet werden. Referenzen K. Svennevig et al., “A large frozen debris avalanche entraining warming permafrost ground—the June 2021 Assapaat landslide, West Greenland,” Landslides, July 2022. http://doi.org/10.1007/s10346-022-01922-7 https://doi.org/10.1007/s10346-022-01922-7 @article{svennevig_large_2022, title = {A large frozen debris avalanche entraining warming permafrost ground—the {June} 2021 {Assapaat} landslide, {West} {Greenland}}, issn = {1612-5118}, url = {https://doi.org/10.1007/s10346-022-01922-7}, doi = {10.1007/s10346-022-01922-7}, language = {en}, urldate = {2022-08-15}, journal = {Landslides}, author = {Svennevig, Kristian and Hermanns, Reginald L. and Keiding, Marie and Binder, Daniel and Citterio, Michele and Dahl-Jensen, Trine and Mertl, Stefan and Sørensen, Erik Vest and Voss, Peter H.}, month = jul, year = {2022}, keywords = {Assapaat landslide, Global warming, Slope temperature}, file = {svennevig_et_al_2022_a_large_frozen_debris_avalanche_entraining_warming_permafrost_ground—the_june.pdf:/home/stefan/01_gtd/05_dokumente/bibliothek/zotero/storage/646U8A6Q/svennevig_et_al_2022_a_large_frozen_debris_avalanche_entraining_warming_permafrost_ground—the_june.pdf:application/pdf} } E. Brückl, P. Carniel, S. Mertl, and R. Meurers, “Seismological Data Acquisition and Analysis within the Scope of Citizen Science,” in Earthquakes, IntechOpen, 2021. http://doi.org/10.5772/intechopen.95273 https://www.intechopen.com/chapters/74466 @incollection{bruckl_seismological_2021, title = {Seismological {Data} {Acquisition} and {Analysis} within the {Scope} of {Citizen} {Science}}, url = {https://www.intechopen.com/chapters/74466}, language = {en}, urldate = {2021-04-07}, booktitle = {Earthquakes}, publisher = {IntechOpen}, author = {Brückl, Ewald and Carniel, Peter and Mertl, Stefan and Meurers, Rita}, month = jan, year = {2021}, doi = {10.5772/intechopen.95273}, project = {macro_seismic_network}, group = {article} } E. Brückl, P. Carniel, S. Mertl, and R. Meurers, “Das Macroseismic Sensor Projekt,” Österreichische Zeitschrift für Vermessung &amp; Geoinformation, vol. 109, no. 3, pp. 114–130, 2021. https://www.ovg.at/de/vgi/ausgabe/1301/ @article{bruckl_macroseismic_2021, title = {Das {Macroseismic} {Sensor} {Projekt}}, url = {https://www.ovg.at/de/vgi/ausgabe/1301/}, volume = {109}, language = {de}, number = {3}, journal = {Österreichische Zeitschrift für Vermessung \&amp; Geoinformation}, author = {Brückl, Ewald and Carniel, Peter and Mertl, Stefan and Meurers, Rita}, year = {2021}, pages = {114--130}, project = {macro_seismic_network}, group = {article} }]]></summary><media:thumbnail xmlns:media="http://search.yahoo.com/mrss/" url="https://www.mertl-research.at/%7B%22homepage%22=%3E%22frontpage.jpg%22,%20%22featured%22=%3E%22frontpage.jpg%22%7D" /><media:content medium="image" url="https://www.mertl-research.at/%7B%22homepage%22=%3E%22frontpage.jpg%22,%20%22featured%22=%3E%22frontpage.jpg%22%7D" xmlns:media="http://search.yahoo.com/mrss/" /></entry><entry xml:lang="en"><title type="html">New Publications</title><link href="https://www.mertl-research.at/en/publications/" rel="alternate" type="text/html" title="New Publications" /><published>2022-08-15T00:00:00+02:00</published><updated>2022-08-15T00:00:00+02:00</updated><id>https://www.mertl-research.at/en/publications</id><content type="html" xml:base="https://www.mertl-research.at/en/publications/"><![CDATA[<p>I contributed as a co-author to some interesting scientific publications.</p>

<h2 id="mss-network">MSS Network</h2>
<p>In the Open Access chapter “<a href="https://www.intechopen.com/chapters/74466">Seismological Data Acquisition and Analysis within the Scope of Citizen Science</a>” <a class="citation" href="#bruckl_seismological_2021">[1]</a> of the book “<a href="https://www.intechopen.com/books/9993" target="blank">Earthquakes</a>” we describe the methods used for processing an visualizing the data of the <a href="https://www.macroseismicsensor.at" target="blank">MSS Netzwerks</a>.</p>

<p>The introduction of the MSS Network in german language is available in the article “Das Macroseismic Sensor Projekt” <a class="citation" href="#bruckl_macroseismic_2021">[2]</a> in the Journal “Österreichische Zeitschrift für Vermessung &amp; Geoinformation”. Unfortunately this article is not yet freely available.</p>

<h2 id="mass-movement-in-greenland">Mass Movement in Greenland</h2>
<p>Within the framework of the project “<a href="https://www.geocenter.dk/projekter/2020-2/now-noise-of-thaw/" target="blank">NOW - NOise of thaW</a>” of the <a href="https://eng.geus.dk/" target="blank">Geological Survey of Denmark and Greenland</a> I’m involved in the instrumentation and data processing of seismic monitoring stations in Greenland. In June 2021, a mass movement happened in Assapaat, West-Greenland. A study site of the NOW project was within 10 km distance to this mass movement. This event is described in detail in the article 
“<a href="https://link.springer.com/article/10.1007/s10346-022-01922-7" target="blank">A large frozen debris avalanche entraining warming permafrost ground—the June 2021 Assapaat landslide, West Greenland</a>” <a class="citation" href="#svennevig_large_2022">[3]</a>. Surprisingly, we found only weak signals related to the mass movement on the NOW stations and the Greenland regional seismic network.</p>

<h2 id="references">References</h2>
<ul class="bibliography"><li><div class="text-justify"><span id="svennevig_large_2022">K. Svennevig <i>et al.</i>, “A large frozen debris avalanche entraining warming permafrost ground—the June 2021 Assapaat landslide, West Greenland,” <i>Landslides</i>, July 2022.</span></div>

<a href="http://doi.org/10.1007/s10346-022-01922-7" target="_blank">http://doi.org/10.1007/s10346-022-01922-7</a>


<a href="https://doi.org/10.1007/s10346-022-01922-7">https://doi.org/10.1007/s10346-022-01922-7</a><br />


<a id="asvennevig_large_2022" style="display: none;">
<pre>@article{svennevig_large_2022,
  title = {A large frozen debris avalanche entraining warming permafrost ground—the {June} 2021 {Assapaat} landslide, {West} {Greenland}},
  issn = {1612-5118},
  url = {https://doi.org/10.1007/s10346-022-01922-7},
  doi = {10.1007/s10346-022-01922-7},
  language = {en},
  urldate = {2022-08-15},
  journal = {Landslides},
  author = {Svennevig, Kristian and Hermanns, Reginald L. and Keiding, Marie and Binder, Daniel and Citterio, Michele and Dahl-Jensen, Trine and Mertl, Stefan and Sørensen, Erik Vest and Voss, Peter H.},
  month = jul,
  year = {2022},
  keywords = {Assapaat landslide, Global warming, Slope temperature},
  file = {svennevig_et_al_2022_a_large_frozen_debris_avalanche_entraining_warming_permafrost_ground—the_june.pdf:/home/stefan/01_gtd/05_dokumente/bibliothek/zotero/storage/646U8A6Q/svennevig_et_al_2022_a_large_frozen_debris_avalanche_entraining_warming_permafrost_ground—the_june.pdf:application/pdf}
}
</pre>
</a>
<script>
function toggleBibtexsvennevig_large_2022(parameter) {
    var x= document.getElementById('asvennevig_large_2022');
    if (x.style.display === 'none') {
        x.style.display = 'block';
    } else {
        x.style.display = 'none';
    }
}
</script>
</li>
<li><div class="text-justify"><span id="bruckl_seismological_2021">E. Brückl, P. Carniel, S. Mertl, and R. Meurers, “Seismological Data Acquisition and Analysis within the Scope of Citizen Science,” in <i>Earthquakes</i>, IntechOpen, 2021.</span></div>

<a href="http://doi.org/10.5772/intechopen.95273" target="_blank">http://doi.org/10.5772/intechopen.95273</a>


<a href="https://www.intechopen.com/chapters/74466">https://www.intechopen.com/chapters/74466</a><br />


<a id="abruckl_seismological_2021" style="display: none;">
<pre>@incollection{bruckl_seismological_2021,
  title = {Seismological {Data} {Acquisition} and {Analysis} within the {Scope} of {Citizen} {Science}},
  url = {https://www.intechopen.com/chapters/74466},
  language = {en},
  urldate = {2021-04-07},
  booktitle = {Earthquakes},
  publisher = {IntechOpen},
  author = {Brückl, Ewald and Carniel, Peter and Mertl, Stefan and Meurers, Rita},
  month = jan,
  year = {2021},
  doi = {10.5772/intechopen.95273},
  project = {macro_seismic_network},
  group = {article}
}
</pre>
</a>
<script>
function toggleBibtexbruckl_seismological_2021(parameter) {
    var x= document.getElementById('abruckl_seismological_2021');
    if (x.style.display === 'none') {
        x.style.display = 'block';
    } else {
        x.style.display = 'none';
    }
}
</script>
</li>
<li><div class="text-justify"><span id="bruckl_macroseismic_2021">E. Brückl, P. Carniel, S. Mertl, and R. Meurers, “Das Macroseismic Sensor Projekt,” <i>Österreichische Zeitschrift für Vermessung &amp; Geoinformation</i>, vol. 109, no. 3, pp. 114–130, 2021.</span></div>


<a href="https://www.ovg.at/de/vgi/ausgabe/1301/">https://www.ovg.at/de/vgi/ausgabe/1301/</a><br />


<a id="abruckl_macroseismic_2021" style="display: none;">
<pre>@article{bruckl_macroseismic_2021,
  title = {Das {Macroseismic} {Sensor} {Projekt}},
  url = {https://www.ovg.at/de/vgi/ausgabe/1301/},
  volume = {109},
  language = {de},
  number = {3},
  journal = {Österreichische Zeitschrift für Vermessung \&amp; Geoinformation},
  author = {Brückl, Ewald and Carniel, Peter and Mertl, Stefan and Meurers, Rita},
  year = {2021},
  pages = {114--130},
  project = {macro_seismic_network},
  group = {article}
}
</pre>
</a>
<script>
function toggleBibtexbruckl_macroseismic_2021(parameter) {
    var x= document.getElementById('abruckl_macroseismic_2021');
    if (x.style.display === 'none') {
        x.style.display = 'block';
    } else {
        x.style.display = 'none';
    }
}
</script>
</li></ul>]]></content><author><name>Stefan Mertl</name></author><summary type="html"><![CDATA[I contributed as a co-author to some interesting scientific publications. MSS Network In the Open Access chapter “Seismological Data Acquisition and Analysis within the Scope of Citizen Science” [3] of the book “Earthquakes” we describe the methods used for processing an visualizing the data of the MSS Netzwerks. The introduction of the MSS Network in german language is available in the article “Das Macroseismic Sensor Projekt” [3] in the Journal “Österreichische Zeitschrift für Vermessung &amp; Geoinformation”. Unfortunately this article is not yet freely available. Mass Movement in Greenland Within the framework of the project “NOW - NOise of thaW” of the Geological Survey of Denmark and Greenland I’m involved in the instrumentation and data processing of seismic monitoring stations in Greenland. In June 2021, a mass movement happened in Assapaat, West-Greenland. A study site of the NOW project was within 10 km distance to this mass movement. This event is described in detail in the article “A large frozen debris avalanche entraining warming permafrost ground—the June 2021 Assapaat landslide, West Greenland” [3]. Surprisingly, we found only weak signals related to the mass movement on the NOW stations and the Greenland regional seismic network. References K. Svennevig et al., “A large frozen debris avalanche entraining warming permafrost ground—the June 2021 Assapaat landslide, West Greenland,” Landslides, July 2022. http://doi.org/10.1007/s10346-022-01922-7 https://doi.org/10.1007/s10346-022-01922-7 @article{svennevig_large_2022, title = {A large frozen debris avalanche entraining warming permafrost ground—the {June} 2021 {Assapaat} landslide, {West} {Greenland}}, issn = {1612-5118}, url = {https://doi.org/10.1007/s10346-022-01922-7}, doi = {10.1007/s10346-022-01922-7}, language = {en}, urldate = {2022-08-15}, journal = {Landslides}, author = {Svennevig, Kristian and Hermanns, Reginald L. and Keiding, Marie and Binder, Daniel and Citterio, Michele and Dahl-Jensen, Trine and Mertl, Stefan and Sørensen, Erik Vest and Voss, Peter H.}, month = jul, year = {2022}, keywords = {Assapaat landslide, Global warming, Slope temperature}, file = {svennevig_et_al_2022_a_large_frozen_debris_avalanche_entraining_warming_permafrost_ground—the_june.pdf:/home/stefan/01_gtd/05_dokumente/bibliothek/zotero/storage/646U8A6Q/svennevig_et_al_2022_a_large_frozen_debris_avalanche_entraining_warming_permafrost_ground—the_june.pdf:application/pdf} } E. Brückl, P. Carniel, S. Mertl, and R. Meurers, “Seismological Data Acquisition and Analysis within the Scope of Citizen Science,” in Earthquakes, IntechOpen, 2021. http://doi.org/10.5772/intechopen.95273 https://www.intechopen.com/chapters/74466 @incollection{bruckl_seismological_2021, title = {Seismological {Data} {Acquisition} and {Analysis} within the {Scope} of {Citizen} {Science}}, url = {https://www.intechopen.com/chapters/74466}, language = {en}, urldate = {2021-04-07}, booktitle = {Earthquakes}, publisher = {IntechOpen}, author = {Brückl, Ewald and Carniel, Peter and Mertl, Stefan and Meurers, Rita}, month = jan, year = {2021}, doi = {10.5772/intechopen.95273}, project = {macro_seismic_network}, group = {article} } E. Brückl, P. Carniel, S. Mertl, and R. Meurers, “Das Macroseismic Sensor Projekt,” Österreichische Zeitschrift für Vermessung &amp; Geoinformation, vol. 109, no. 3, pp. 114–130, 2021. https://www.ovg.at/de/vgi/ausgabe/1301/ @article{bruckl_macroseismic_2021, title = {Das {Macroseismic} {Sensor} {Projekt}}, url = {https://www.ovg.at/de/vgi/ausgabe/1301/}, volume = {109}, language = {de}, number = {3}, journal = {Österreichische Zeitschrift für Vermessung \&amp; Geoinformation}, author = {Brückl, Ewald and Carniel, Peter and Mertl, Stefan and Meurers, Rita}, year = {2021}, pages = {114--130}, project = {macro_seismic_network}, group = {article} }]]></summary><media:thumbnail xmlns:media="http://search.yahoo.com/mrss/" url="https://www.mertl-research.at/%7B%22homepage%22=%3E%22frontpage.jpg%22,%20%22featured%22=%3E%22frontpage.jpg%22%7D" /><media:content medium="image" url="https://www.mertl-research.at/%7B%22homepage%22=%3E%22frontpage.jpg%22,%20%22featured%22=%3E%22frontpage.jpg%22%7D" xmlns:media="http://search.yahoo.com/mrss/" /></entry><entry xml:lang="de"><title type="html">Glacioburst Sounds im Stadtradio Göttingen</title><link href="https://www.mertl-research.at/seismogroovebox/glacioburst_sounds_stadtradio_goettingen/" rel="alternate" type="text/html" title="Glacioburst Sounds im Stadtradio Göttingen" /><published>2020-06-09T00:00:00+02:00</published><updated>2020-06-09T00:00:00+02:00</updated><id>https://www.mertl-research.at/seismogroovebox/glacioburst_sounds_stadtradio_goettingen</id><content type="html" xml:base="https://www.mertl-research.at/seismogroovebox/glacioburst_sounds_stadtradio_goettingen/"><![CDATA[<p>Das <a href="https://www.dt-goettingen.de/" target="blank">Deutsche Theater Göttingen</a> hat im Jahr 2020 während der Coronapandemie die Sendereihe <a href="https://www.stadtradio-goettingen.de/buergerfunk/buergerfunksendungen/dt_ohrengold/" target="blank">DT Ohrengold</a> im Rahmen des Bürgerfunk des <a href="https://www.stadtradio-goettingen.de/" target="blank">Stadtradio Göttingen</a> gestartet, die monatlich ausgestrahlt wird. In dieser Sendereihe gibt es das Feature <em>Das elektroakustische Schatzkästlein</em>, das von Bernd Schumann gestaltet wird.</p>

<p>Das elektroakustische Schatzkästlein, das am 4. Juni 2021 ausgestrahlt wurde, beschäftigte sich mit den Sonifikationen der Glacioburst Messungen die im Blog-Eintrag <a href="/seismogroovebox/sonification_of_ambient_seismic_noise/">Dem seismischen Rauschen zuhören</a> näher beschrieben sind und im <a href="/maar_radio/">m-aar radio</a> als Audiostream verfügbar sind.</p>

<p>Es hat mich sehr gefreut, dass ich in diesem Rahmen meine Erlebnisse und meine Motivation für die Vertonung in einem kurzen Interview ausführen konnte. Der Radiobeitrag wurde mir freundlicherweise zur Bereitstellung auf meiner Homepage zu Verfügung gestellt und er kann nun jederzeit nachgehört werden. Besten Dank an das Team des Deutschen Theaters Göttingen.</p>

<div id="mr-audioplayer-1" class="audio-player-wrapper">
    
    <div id="mrap-trackinfo-1" class="track-info">
        <div id="mrap-current-title-1" class="title">Beitrag vom 4. Juni 2021</div>
        <div id="mrap-current-artist-1" class="artist">Deutsches Theater Göttingen</div>
        <div id="mrap-current-album-1" class="album">Elektroakustisches Schatzkästlein</div>
        <div id="mrap-current-description-1" class="description">Elektroakustisches Schatzkästlein der Sendung des Deutschen Theaters Göttingen im Stadtradio Göttingen. Ausgestrahlt am 4. Juni 2021.</div>
    </div>
    <audio id="mrap-audio-1" controls="controls" preload="auto">
        <source src="/assets/audio/maar_records/elektroakustisches_schatzkaestlein/schatzkaestlein_08.mp3" type="audio/mp3" />&lt;/source&gt;
        Your browser doesn't support the audio player.
    </audio>
    <ul id="mrap-playlist-1" class="playlist custom-counter">
        
            <li id="mrap-trackitem-1-1">
                <div class="track">
                    <div id="mrap-trackplay-1-1" class="track-play" data-url="/assets/audio/maar_records/elektroakustisches_schatzkaestlein/schatzkaestlein_08.mp3" data-title="Beitrag vom 4. Juni 2021" data-artist="Deutsches Theater Göttingen" data-album="Elektroakustisches Schatzkästlein" data-description="Elektroakustisches Schatzkästlein der Sendung des Deutschen Theaters Göttingen im Stadtradio Göttingen. Ausgestrahlt am 4. Juni 2021." data-img="/images/maar_records/elektroakustisches_schatzkaestlein/"><i class="far fa-play-circle"></i></div>
                    <div class="track-info">
                        <div class="title">Beitrag vom 4. Juni 2021</div>
                        <div class="artist">Deutsches Theater Göttingen</div>
                        
                           <div class="license no-bubble">copyright Deutsches Theater Göttingen</div>
                        
                        
                    </div>
                </div>
            </li>

        
    </ul>
</div>]]></content><author><name>Stefan Mertl</name></author><category term="seismogroovebox" /><summary type="html"><![CDATA[Das Deutsche Theater Göttingen hat im Jahr 2020 während der Coronapandemie die Sendereihe DT Ohrengold im Rahmen des Bürgerfunk des Stadtradio Göttingen gestartet, die monatlich ausgestrahlt wird. In dieser Sendereihe gibt es das Feature Das elektroakustische Schatzkästlein, das von Bernd Schumann gestaltet wird. Das elektroakustische Schatzkästlein, das am 4. Juni 2021 ausgestrahlt wurde, beschäftigte sich mit den Sonifikationen der Glacioburst Messungen die im Blog-Eintrag Dem seismischen Rauschen zuhören näher beschrieben sind und im m-aar radio als Audiostream verfügbar sind. Es hat mich sehr gefreut, dass ich in diesem Rahmen meine Erlebnisse und meine Motivation für die Vertonung in einem kurzen Interview ausführen konnte. Der Radiobeitrag wurde mir freundlicherweise zur Bereitstellung auf meiner Homepage zu Verfügung gestellt und er kann nun jederzeit nachgehört werden. Besten Dank an das Team des Deutschen Theaters Göttingen. Beitrag vom 4. Juni 2021 Deutsches Theater Göttingen Elektroakustisches Schatzkästlein Elektroakustisches Schatzkästlein der Sendung des Deutschen Theaters Göttingen im Stadtradio Göttingen. Ausgestrahlt am 4. Juni 2021. &lt;/source&gt; Your browser doesn't support the audio player. Beitrag vom 4. Juni 2021 Deutsches Theater Göttingen copyright Deutsches Theater Göttingen]]></summary><media:thumbnail xmlns:media="http://search.yahoo.com/mrss/" url="https://www.mertl-research.at/%7B%22homepage%22=%3E%22frontpage.jpg%22,%20%22featured%22=%3E%22frontpage.jpg%22%7D" /><media:content medium="image" url="https://www.mertl-research.at/%7B%22homepage%22=%3E%22frontpage.jpg%22,%20%22featured%22=%3E%22frontpage.jpg%22%7D" xmlns:media="http://search.yahoo.com/mrss/" /></entry><entry xml:lang="en"><title type="html">Glacioburst Sounds in Stadtradio Göttingen</title><link href="https://www.mertl-research.at/en/seismogroovebox/glacioburst_sounds_stadtradio_goettingen/" rel="alternate" type="text/html" title="Glacioburst Sounds in Stadtradio Göttingen" /><published>2020-06-09T00:00:00+02:00</published><updated>2020-06-09T00:00:00+02:00</updated><id>https://www.mertl-research.at/en/seismogroovebox/glacioburst_sounds_stadtradio_goettingen</id><content type="html" xml:base="https://www.mertl-research.at/en/seismogroovebox/glacioburst_sounds_stadtradio_goettingen/"><![CDATA[<p>In 2020, the <a href="https://www.dt-goettingen.de/" target="blank">Deutsche Theater Göttingen</a> started the monthly radio show <a href="https://www.stadtradio-goettingen.de/buergerfunk/buergerfunksendungen/dt_ohrengold/" target="blank">DT Ohrengold</a> within the <em>Bürgerfunk</em> program of <a href="https://www.stadtradio-goettingen.de/" target="blank">Stadtradio Göttingen</a>. In this show, the short feature <em>Das elektroakustische Schatzkästlein</em> (the electroacoustic treasure box) is created by Bernd Schumann.</p>

<p>Das elektroakustische Schatzkästlein, broadcasted on June 4, 2021, highlighted the Glacioburst Sonification, that is described in the blog post <a href="/seismogroovebox/sonification_of_ambient_seismic_noise/">Listen to seismic noise</a> and which is available as an audiostream in  <a href="/maar_radio/">m-aar radio</a>.</p>

<p>It was a great pleasure, that I was invited to talk in a short interview about my experience and my motivation to sonify the seismic data. The radio feature was kindly provided to be published on my homepage. Many thanks to the Team of Deusches Theater Göttingen.</p>

<div id="mr-audioplayer-1" class="audio-player-wrapper">
    
    <div id="mrap-trackinfo-1" class="track-info">
        <div id="mrap-current-title-1" class="title">Beitrag vom 4. Juni 2021</div>
        <div id="mrap-current-artist-1" class="artist">Deutsches Theater Göttingen</div>
        <div id="mrap-current-album-1" class="album">Elektroakustisches Schatzkästlein</div>
        <div id="mrap-current-description-1" class="description">Elektroakustisches Schatzkästlein der Sendung des Deutschen Theaters Göttingen im Stadtradio Göttingen. Ausgestrahlt am 4. Juni 2021.</div>
    </div>
    <audio id="mrap-audio-1" controls="controls" preload="auto">
        <source src="/assets/audio/maar_records/elektroakustisches_schatzkaestlein/schatzkaestlein_08.mp3" type="audio/mp3" />&lt;/source&gt;
        Your browser doesn't support the audio player.
    </audio>
    <ul id="mrap-playlist-1" class="playlist custom-counter">
        
            <li id="mrap-trackitem-1-1">
                <div class="track">
                    <div id="mrap-trackplay-1-1" class="track-play" data-url="/assets/audio/maar_records/elektroakustisches_schatzkaestlein/schatzkaestlein_08.mp3" data-title="Beitrag vom 4. Juni 2021" data-artist="Deutsches Theater Göttingen" data-album="Elektroakustisches Schatzkästlein" data-description="Elektroakustisches Schatzkästlein der Sendung des Deutschen Theaters Göttingen im Stadtradio Göttingen. Ausgestrahlt am 4. Juni 2021." data-img="/images/maar_records/elektroakustisches_schatzkaestlein/"><i class="far fa-play-circle"></i></div>
                    <div class="track-info">
                        <div class="title">Beitrag vom 4. Juni 2021</div>
                        <div class="artist">Deutsches Theater Göttingen</div>
                        
                           <div class="license no-bubble">copyright Deutsches Theater Göttingen</div>
                        
                        
                    </div>
                </div>
            </li>

        
    </ul>
</div>]]></content><author><name>Stefan Mertl</name></author><category term="seismogroovebox" /><summary type="html"><![CDATA[In 2020, the Deutsche Theater Göttingen started the monthly radio show DT Ohrengold within the Bürgerfunk program of Stadtradio Göttingen. In this show, the short feature Das elektroakustische Schatzkästlein (the electroacoustic treasure box) is created by Bernd Schumann. Das elektroakustische Schatzkästlein, broadcasted on June 4, 2021, highlighted the Glacioburst Sonification, that is described in the blog post Listen to seismic noise and which is available as an audiostream in m-aar radio. It was a great pleasure, that I was invited to talk in a short interview about my experience and my motivation to sonify the seismic data. The radio feature was kindly provided to be published on my homepage. Many thanks to the Team of Deusches Theater Göttingen. Beitrag vom 4. Juni 2021 Deutsches Theater Göttingen Elektroakustisches Schatzkästlein Elektroakustisches Schatzkästlein der Sendung des Deutschen Theaters Göttingen im Stadtradio Göttingen. Ausgestrahlt am 4. Juni 2021. &lt;/source&gt; Your browser doesn't support the audio player. Beitrag vom 4. Juni 2021 Deutsches Theater Göttingen copyright Deutsches Theater Göttingen]]></summary><media:thumbnail xmlns:media="http://search.yahoo.com/mrss/" url="https://www.mertl-research.at/%7B%22homepage%22=%3E%22frontpage.jpg%22,%20%22featured%22=%3E%22frontpage.jpg%22%7D" /><media:content medium="image" url="https://www.mertl-research.at/%7B%22homepage%22=%3E%22frontpage.jpg%22,%20%22featured%22=%3E%22frontpage.jpg%22%7D" xmlns:media="http://search.yahoo.com/mrss/" /></entry><entry xml:lang="de"><title type="html">Glacioburst Sounds Audiostream</title><link href="https://www.mertl-research.at/seismogroovebox/maar_radio/" rel="alternate" type="text/html" title="Glacioburst Sounds Audiostream" /><published>2020-05-04T00:00:00+02:00</published><updated>2020-05-04T00:00:00+02:00</updated><id>https://www.mertl-research.at/seismogroovebox/maar_radio</id><content type="html" xml:base="https://www.mertl-research.at/seismogroovebox/maar_radio/"><![CDATA[<p>Im Blog-Eintrag <a href="/seismogroovebox/sonification_of_ambient_seismic_noise/">Listen to seismic noise</a> habe ich die Sonifikation der seismischen Daten, die auf einem Ausflussgletscher des A.P.Olsen Eisschilds in Grönland aufgezeichnet wurden, beschrieben. Die Sonifikation des kompletten Datensatzes die den Füll und Entleerungs Zyklus eines vom Gletscher blockierten Sees beinhalten sind nun als kontinuierlicher Audiostream auf der Seite <a href="/maar_radio/">m-aar radio</a> verfügbar.</p>

<p>Der Audiostream enthält die Daten von 184 Tagen in einer Endlosschleife. Die Sonifikation komprimiert jeden Tag der seismischen Daten zu Audiodaten mit einer Länge von 7 Minuten. Die komplette Länge der Sonifikation beträgt demnach 21 Stunden und 28 Minuten.</p>]]></content><author><name>Stefan Mertl</name></author><category term="seismogroovebox" /><summary type="html"><![CDATA[Im Blog-Eintrag Listen to seismic noise habe ich die Sonifikation der seismischen Daten, die auf einem Ausflussgletscher des A.P.Olsen Eisschilds in Grönland aufgezeichnet wurden, beschrieben. Die Sonifikation des kompletten Datensatzes die den Füll und Entleerungs Zyklus eines vom Gletscher blockierten Sees beinhalten sind nun als kontinuierlicher Audiostream auf der Seite m-aar radio verfügbar. Der Audiostream enthält die Daten von 184 Tagen in einer Endlosschleife. Die Sonifikation komprimiert jeden Tag der seismischen Daten zu Audiodaten mit einer Länge von 7 Minuten. Die komplette Länge der Sonifikation beträgt demnach 21 Stunden und 28 Minuten.]]></summary><media:thumbnail xmlns:media="http://search.yahoo.com/mrss/" url="https://www.mertl-research.at/%7B%22homepage%22=%3E%22frontpage.jpg%22,%20%22featured%22=%3E%22frontpage.jpg%22%7D" /><media:content medium="image" url="https://www.mertl-research.at/%7B%22homepage%22=%3E%22frontpage.jpg%22,%20%22featured%22=%3E%22frontpage.jpg%22%7D" xmlns:media="http://search.yahoo.com/mrss/" /></entry><entry xml:lang="en"><title type="html">Glacioburst Sounds Audiostream</title><link href="https://www.mertl-research.at/en/seismogroovebox/maar_radio/" rel="alternate" type="text/html" title="Glacioburst Sounds Audiostream" /><published>2020-05-04T00:00:00+02:00</published><updated>2020-05-04T00:00:00+02:00</updated><id>https://www.mertl-research.at/en/seismogroovebox/maar_radio</id><content type="html" xml:base="https://www.mertl-research.at/en/seismogroovebox/maar_radio/"><![CDATA[<p>In the post <a href="/en/seismogroovebox/sonification_of_ambient_seismic_noise/">Listen to seismic noise</a> I have described the
sonification of seismic data recorded on an outlet glacier of the A.P. Olsen
icecap in Greenland. The sonification of the data set covering the fill and
drain cycle of a glacier dammed lake is now available as an audiostream at
<a href="/en/maar_radio/">m-aar radio</a>.</p>

<p>The stream provides the data of 184 days in and endless loop. The sonification
compressed each day into an audio stream of 7 minutes length. The total
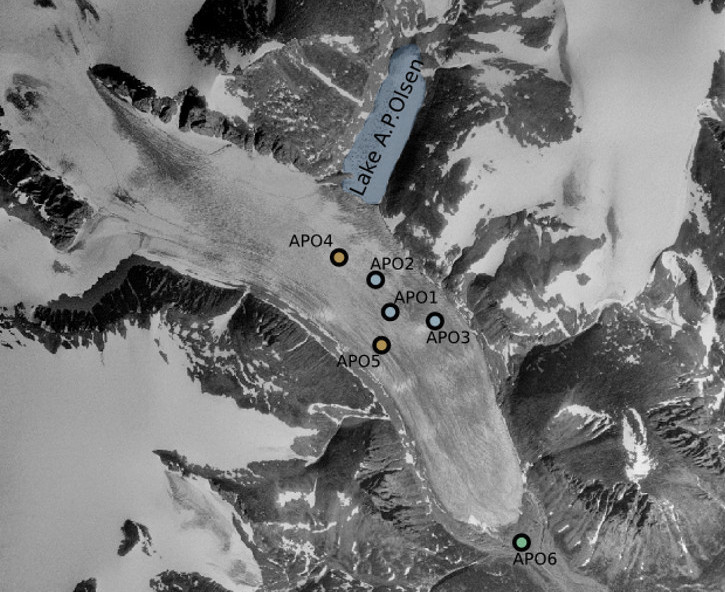
duration of the full data set is therfore 21 hours and 28 minutes.</p>]]></content><author><name>Stefan Mertl</name></author><category term="seismogroovebox" /><summary type="html"><![CDATA[In the post Listen to seismic noise I have described the sonification of seismic data recorded on an outlet glacier of the A.P. Olsen icecap in Greenland. The sonification of the data set covering the fill and drain cycle of a glacier dammed lake is now available as an audiostream at m-aar radio. The stream provides the data of 184 days in and endless loop. The sonification compressed each day into an audio stream of 7 minutes length. The total duration of the full data set is therfore 21 hours and 28 minutes.]]></summary><media:thumbnail xmlns:media="http://search.yahoo.com/mrss/" url="https://www.mertl-research.at/%7B%22homepage%22=%3E%22frontpage.jpg%22,%20%22featured%22=%3E%22frontpage.jpg%22%7D" /><media:content medium="image" url="https://www.mertl-research.at/%7B%22homepage%22=%3E%22frontpage.jpg%22,%20%22featured%22=%3E%22frontpage.jpg%22%7D" xmlns:media="http://search.yahoo.com/mrss/" /></entry><entry xml:lang="de"><title type="html">Dem seismischen Rauschen zuhören</title><link href="https://www.mertl-research.at/seismogroovebox/sonification_of_ambient_seismic_noise/" rel="alternate" type="text/html" title="Dem seismischen Rauschen zuhören" /><published>2019-10-17T00:00:00+02:00</published><updated>2019-10-17T00:00:00+02:00</updated><id>https://www.mertl-research.at/seismogroovebox/sonification_of_ambient_seismic_noise</id><content type="html" xml:base="https://www.mertl-research.at/seismogroovebox/sonification_of_ambient_seismic_noise/"><![CDATA[<p>Im Jahr 2012 nahm ich an einem Forschungsprojekt mit dem Namen GlacioBurst teil, das die Beobachtung eines Gletscherseeausbruchs eines <a href="https://www.openstreetmap.org/search?query=74.6378N%2C%20-21.4196W#map=10/74.6224/-21.4343" target="blank">Auslassgletschers</a> des A.P.Olsen Eisschilds in Grönland zum Ziel hatte. In einem vom Gletscher blockiertem Tal bildet sich während der Schmelzperiode ein See. Der sich zunehmend füllende See (wir bezeichnen ihn als A.P.Olsen See) entleert sich abrupt innerhalb weniger Stunden in einem mehr oder weniger regelmäßigem jährlichen Intervall. Dieser Gletscherseeausbruch erzeugt eine Überflutung im Bereich flussabwärts des Gletscherabflusses, an welchem sich auch die Forschungsstation Zackenberg befindet. Der Gletscherseeausbruch findet üblicherweise im Herbst statt, obwohl auch schon Abweichungen von diesem Muster mit Ausbrüchen im Sommer oder Frühling beobachtet wurden. Während unseres Aufenthalts im Frühling 2012 in Grönland haben wir ein seismisches- und geodätisches Monitoring Netzwerk auf dem Gletscher installiert, um den vollständigen Füll- und Ausbruchszyklus des vom Gletscher blockierten Sees aufzunehmen. Eine kurze Beschreibung unseres Projekts ist im Artikel “INTERACT: stories of Arctic science” <a class="citation" href="#callaghan_interact_2017">[1, p. 42]</a> zu finden.</p>

<div style="padding-bottom: 1.25rem; text-align: center;">
<a href="/images/posts/2019/2019-10-17/apo_monitoring_network.jpg" data-featherlight="image" caption="Das seismische Monitoring Netzwerk auf dem Ausflussgletscher des A.P.Olsen Eisschilds. Es besteht aus fünf Stationen mit seismischen und globales Navigationssatellitensystem (GNSS) Messgeräten direkt auf dem Gletscher und einer GNSS Basisstation beim Fuß des Gletschers.">
<img src="/images/posts/2019/2019-10-17/apo_monitoring_network.jpg" alt="Das seismische Monitoring Netzwerk auf dem Ausflussgletscher des A.P.Olsen Eisschilds. Es besteht aus fünf Stationen mit seismischen und globales Navigationssatellitensystem (GNSS) Messgeräten direkt auf dem Gletscher und einer GNSS Basisstation beim Fuß des Gletschers." />
</a>


<figcaption class="center-caption">
    Das seismische Monitoring Netzwerk auf dem Ausflussgletscher des A.P.Olsen Eisschilds. Es besteht aus fünf Stationen mit seismischen und globales Navigationssatellitensystem (GNSS) Messgeräten direkt auf dem Gletscher und einer GNSS Basisstation beim Fuß des Gletschers.
</figcaption>


</div>

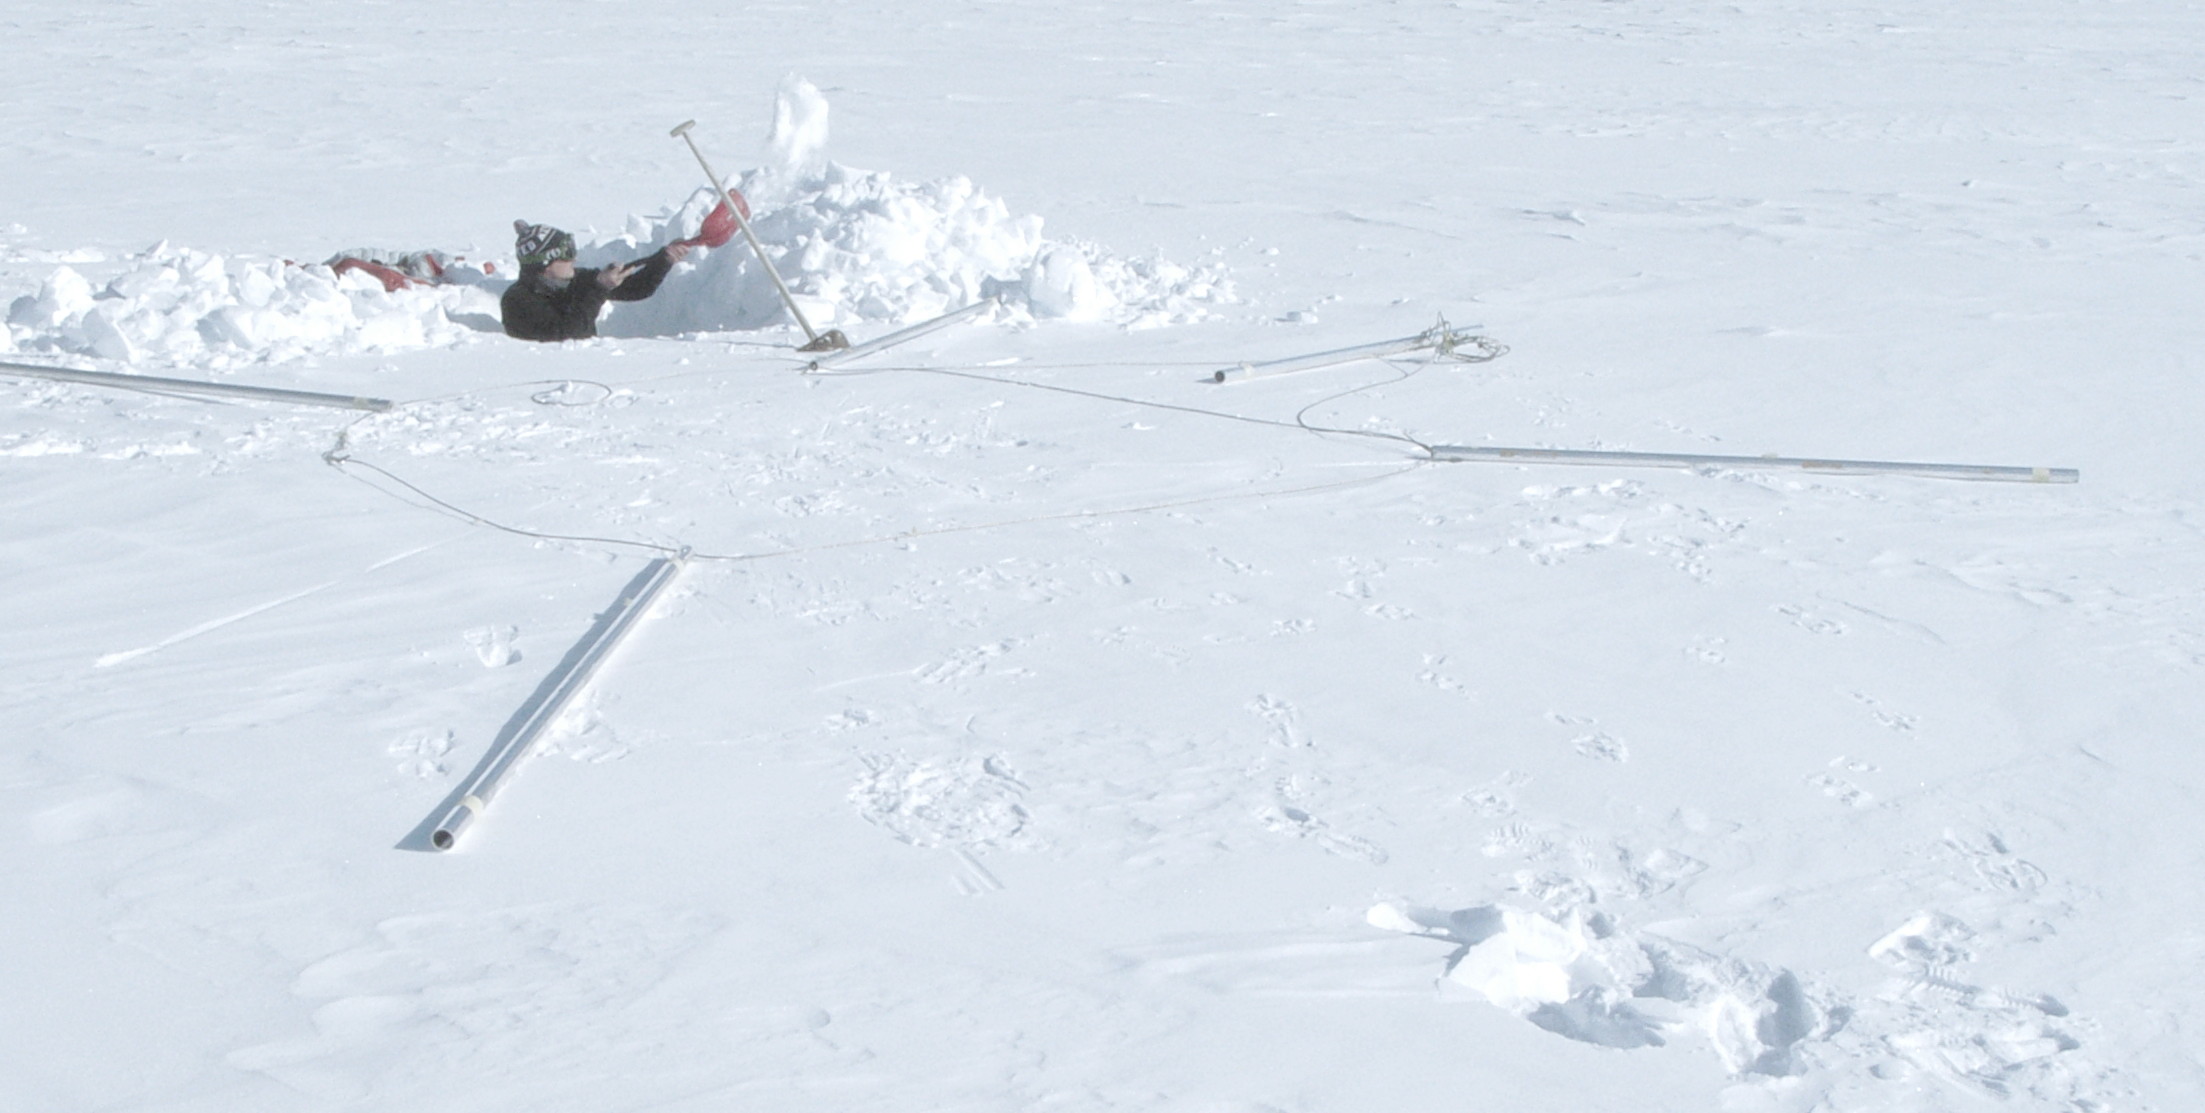
<p>Während unserer Feldarbeiten auf dem Gletscher mussten wir einige vertikale, 1 bis 2 Meter tiefe Schneelöcher graben, um das Eis des Gletschers zu erreichen. Während ich in einem dieser Löcher stand bemerkte ich plötzlich, dass absolute Stille herrschte. Ich habe diese Erfahrung zuvor noch nie in einer freien, natürlichen Umgebung gemacht. Normalerweise, wenn man sich an einem Ort befindet den man als sehr ruhig empfindet, sind immer noch natürliche oder vom Menschen erzeugte Geräusche wahrzunehmen. Aber dieses Mal im Schneeloch in Grönland hörte ich nichts, keine Windgeräusche, kein plätscherndes Wasser, kein Rascheln der Vegetation, keine Tiere, kein menschlich erzeugtes Geräusch, nicht einmal Flugzeuge - einfach Stille.</p>

<div style="padding-bottom: 1.25rem; text-align: center;">
<a href="/images/posts/2019/2019-10-17/snow_pit.jpg" data-featherlight="image">
<img src="/images/posts/2019/2019-10-17/snow_pit.jpg" />
</a>


</div>

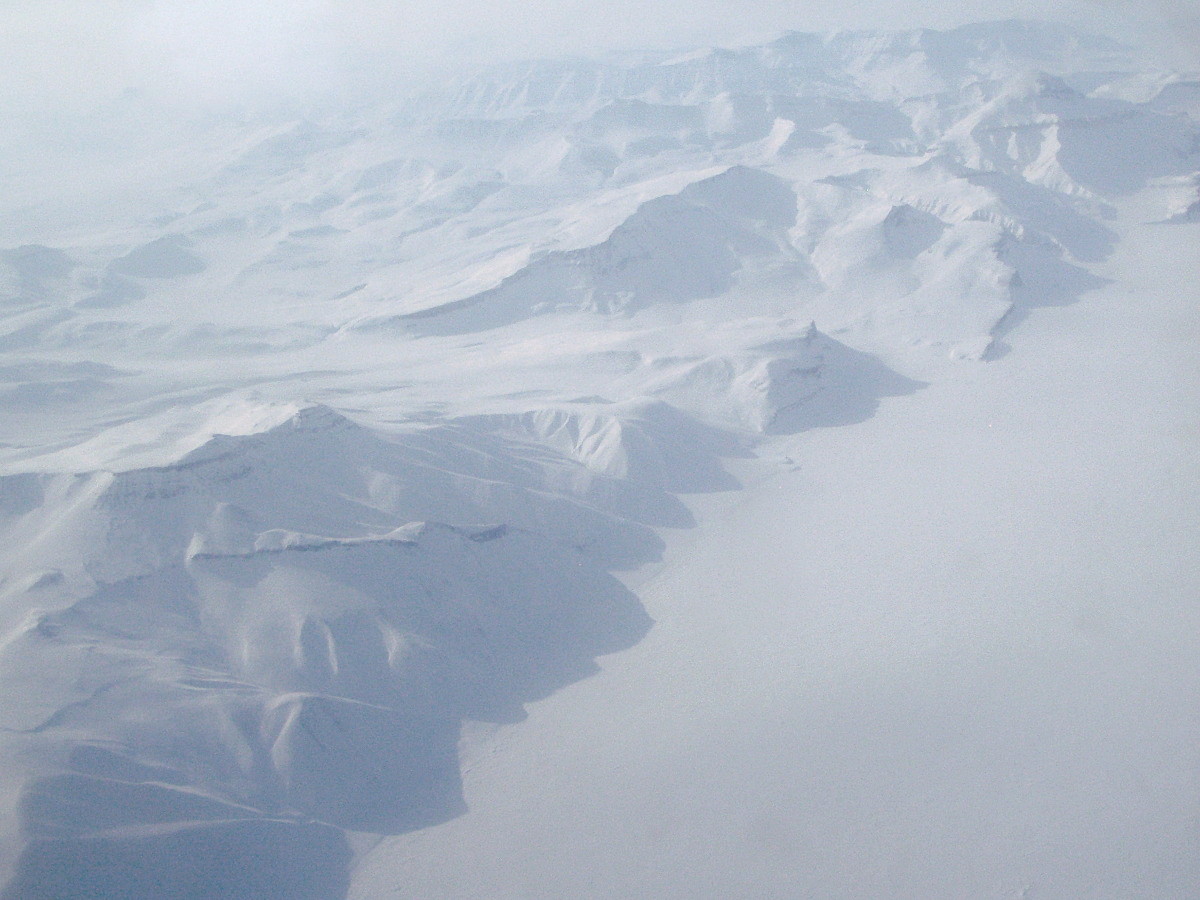
<p>Dieses Erlebnis ließ mich an all die möglichen akustischen Quellen denken, die an dem Ort noch immer präsent waren, aber einfach zu leise sind um von mir gehört zu werden. Als Seismologe wusste ich, dass das Eis unter mir voll von akustischen Wellen war. Die meisten dieser Wellen haben entweder zu geringe Amplituden und/oder zu geringe Frequenzen, um vom Menschen gehört zu werden. Was für eine Geräuschkulisse würden all die seismischen Wellen wohl erzeugen?</p>

<div style="padding-bottom: 1.25rem; text-align: center;">
<a href="/images/posts/2019/2019-10-17/snow_landscape.jpg" data-featherlight="image">
<img src="/images/posts/2019/2019-10-17/snow_landscape.jpg" />
</a>


</div>

<p>Es gab schon etliche Menschen, die sich auf die Suche nach dem Klang seismischer Aufzeichnungen machten. Beispiele dafür sind <a href="http://www.seismicsoundlab.org/" target="blank">seismicsoundslab</a>, <a href="http://www.seismicsounds.net/" target="blank">Beneath and Beyound:
Seismic Sounds</a> oder <a href="https://soundcloud.com/seismicsounds">SeismicSounds on
Soundcloud</a>. Ein gängiger Ansatz, um die tiefen Frequenzen seismischer Signale in den hörbaren Bereich zu transformieren, ist das beschleunigte Abspielen der Seismogramme. Diese Zeitkomprimierung bewahrt die Charakterisitk des Frequenzspektrums, das zeitliche Verhalten geht allerdings verloren. Eine andere Methode ist das Pitch-Shifting der seismischen Aufzeichnungen mit Hilfe eines Phase-Vocoders oder granularer Synthese. Bei seismischen Signalen ist normalerweise eine Erhöhung der Frequenz um einige Oktaven notwendig, was normalerweise den Klang stark durch berechnungs-basierte Artefakte verändert <a class="citation" href="#mcgee_musification_2016">[2]</a>. Diese Artefakte können allerdings auch zu einem Bestandteil des Klang-Designs oder der Komposition werden. Neben der <a href="https://en.wikipedia.org/wiki/Audification" target="blank">Audifikation</a> von Seismogrammen ist das Parameter-Mapping eine weit verbreitete Methode, um die Bodenbewegung in Geräusche und Klänge zu übersetzen (z.B. <a href="https://fault-trace.bandcamp.com/album/2017" target="blank">Fault
Trace</a>). Bei dieser Methode werden charakteristische Eigenschaften der Quelldaten Parametern, die den Klang beschreiben (z.B. Tonhöhe, Lautstärke, Frequenz, …) zugeordnet.</p>

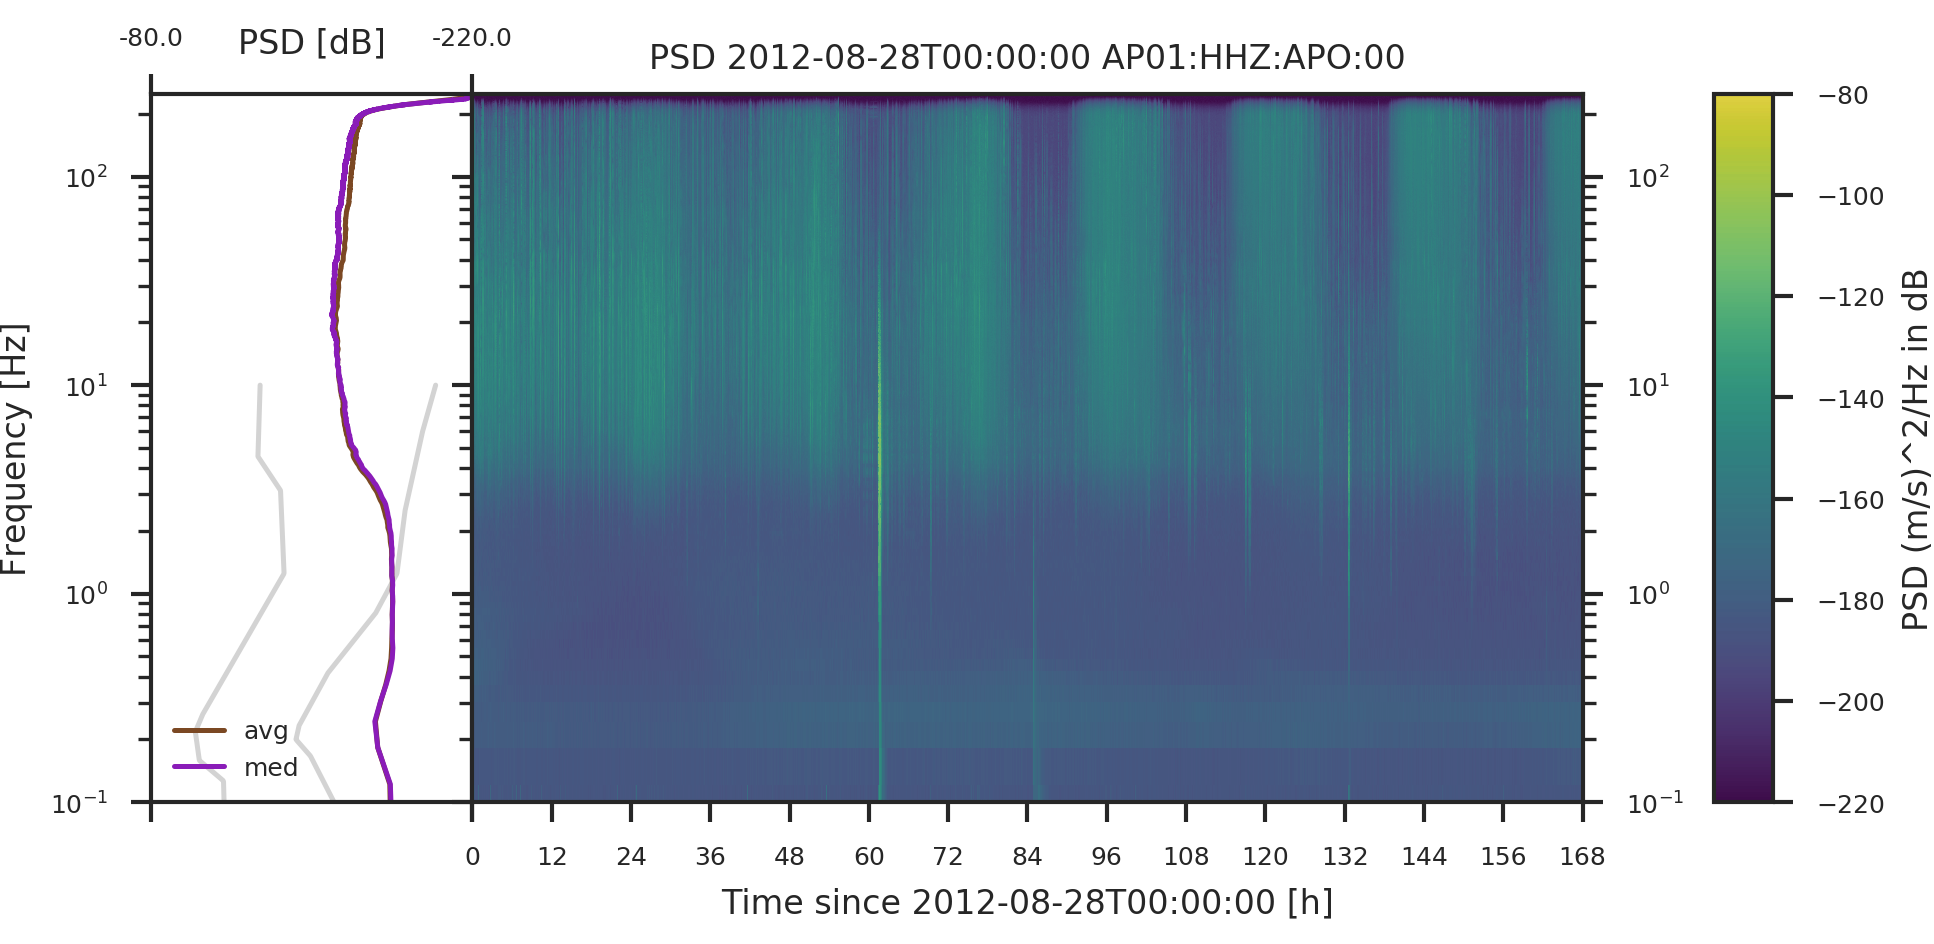
<p>Der Datensatz, den wir auf dem grönländischen Gletscher aufgezeichnet haben umspannt 6 Monate von Mai bis Oktober 2012. Eine Standardmethode bei der Analyse seismischer Zeitreihen ist die Berechnung von Spektrogrammen und der <em>Probability Power Spectral Density</em> <a class="citation" href="#mcnamara_ambient_2004">[3]</a>. Damit erhält man einen guten Überblick über das grundlegende Verhalten des seismischen Hintergrundrauschens und von Perioden, bei denen sich der Frequenzinhalt der seismischen Signale signifikant vom diesem unterscheidet. Die Methoden liefern auch eine gute zeitliche Komprimierung ohne den Verlust wichtiger Informationen. Große Datenmengen können demnach sehr schnell nach Phasen von speziellem seismologischem Interesse durchsucht werden.</p>

<div style="padding-bottom: 1.25rem; text-align: center;">
<a href="/images/posts/2019/2019-10-17/20120828_20120904_apo_ap01_00_hhz.png" data-featherlight="image" caption="Spektrogramm einer Woche der seismischen Daten, die an der Station AP01 aufgezeichnet wurden. Links ist der zeitliche Mittelwert des Spektrogramms mit den Standard Rauchmodellen nach Peterson (graue Linien) dargestellt.">
<img src="/images/posts/2019/2019-10-17/20120828_20120904_apo_ap01_00_hhz.png" alt="Spektrogramm einer Woche der seismischen Daten, die an der Station AP01 aufgezeichnet wurden. Links ist der zeitliche Mittelwert des Spektrogramms mit den Standard Rauchmodellen nach Peterson (graue Linien) dargestellt." />
</a>


<figcaption class="center-caption">
    Spektrogramm einer Woche der seismischen Daten, die an der Station AP01 aufgezeichnet wurden. Links ist der zeitliche Mittelwert des Spektrogramms mit den Standard Rauchmodellen nach Peterson (graue Linien) dargestellt.
</figcaption>


</div>

<p>Das oben dargestellte Spektrogramm hebt die Stärken dieser Langzeit Spektrogramme hervor. Einige Muster stechen sofort hervor. Die beiden breitbandigen, scharfen vertikalen Linien gleich nach den Stunden 60 und 84 mit hoher Energie bis weit in die tiefen Frequenzen markieren zwei starke Erdbeben  (<a href="https://www.seismicportal.eu/eventdetails.html?unid=20120830_0000050#originsSection" target="blank">Mw = 6.6</a> und <a href="https://www.seismicportal.eu/eventdetails.html?unid=20120830_0000053" target="blank">Mb = 5.3</a>) mit einem Epizentrum in der Nähen der <a href="https://en.wikipedia.org/wiki/Jan_Mayen" target="blank">Jan Mayen Inseln</a>. Mehrere folgende ähnliche Signale, aber nicht mit einem vergleichbar starkem Anteil niederfrequenter Signalinhalte, markieren Nachbeben des Jan Mayen Hauptbebens. Weiters ist im Frequenzbereich über 4 Hz das Auftreten von täglichen Mustern im seismischen Rauschen zu erkennen. Ein genauerer Blick in die seismischen Daten zeigte, dass dieses Rauschen durch eine große Anzahl von Eisbeben innerhalb kurzer Zeitintervallen (kleiner einiger Sekunden)  erzeugt wurde. Das führt sofort zu der Frage: <em>“Was ist das Rauschen?”</em>. Nach Scales und Snieder <a class="citation" href="#scales_what_1998">[4]</a>, ist das Rauschen der Teil der Daten, den wir nicht versuchen zu erklären. Das Rauschen ist also der Signalanteil, der den Beobachter nicht interessiert und der ihn bei der Suche nach seinen Signalen eventuell stören kann. Dieser sehr subjektive Ansatz spiegelt sich auch in dem zuvor beschriebenem täglichen Muster wieder, bei dem der Unterschied zwischen Signal und Rauschen durch den Beobachtungszeitraum und das temporale Auflösungsvermögen bestimmt wird.</p>

<p>Die detaillierte Untersuchung des seismischen Hintergrundrauschens führte zu drei Fragen, die ich versuche mit akustischen Methoden zu erforschen: Wie beeinflusst die zeitliche Auflösung die Wahrnehmung von Rauschen? Wann verwandelt sich ein Signal in Rauschen, und wann wird das Rauschen zum Signal?</p>

<p>Mein Startpunkt für die Erzeugung einer Klang-Textur <a class="citation" href="#schwarz_state_2011">[5]</a>, die das seismischen Hintergrundrauschen repräsentiert, ist die Sonifikation von seismogrammen. Ich verwende die selbst entwickelte Software <a href="/projects/psysmon" target="blank">psysmon</a> für die Datenanalyse und die Signalverarbeitung, selbst entwickelte <a href="https://www.python.org/" target="blank">Python</a> Skripte für die Vorbereitung der Daten und <a href="https://supercollider.github.io/" target="blank">SuperCollider</a> für die Sonifikation.</p>

<p>Mein erster Ansatz für die Sonifikation besteht aus der Erzeugung einer Oszillator-Bank, die auf den lokalen Frequenzspitzen des Energiedichtespecktrums der Seismogramme basiert. Zusätzlich wird das Noise-Shaping weißen Rauschens mit dem Energiedichtespektrum der Seismogramme verwendet, um die Frequenzen der Spektren in den höhrbaren Bereich zu verschieben. Die zeitliche Entwicklung ergibt sich durch den Durchlauf der Frequenzspektren der Spektrogramme. Die Sonifikation erfolgt für jede der 5 Stationen des seismischen Netzwerks einzeln und wird im Stereofeld verteilt.</p>

<p>Folgend sind die Sonifikationen von 4 Tagen des GlacioBurst Datensatzes zu finden. Die Bilder der einzelnen Tracks zeigen die Spektrogramme der Station AP01 einer Woche. Die Zeitspanne, die für die Sonifikation verwendet wurde ist in diesen Bildern hervorgehoben. Die ausgewählten Beispiele zeigen charakteristischen Eigenschaften des seismischen Hintergrundrauschens am A.P.Olsen Eisschild Ausflussgletscher und einige herausstechende Ereignisse.</p>

<p><em>Ich empfehle die Verwendung von Kopfhörern für das Anhören der Klangbeispiele.</em></p>

<div id="mr-audioplayer-1" class="audio-player-wrapper">
    
       <img class="audio-player-cover" id="mrap-current-cover-1" src="/images/maar_records/glacioburst_sounds/doy_125_20120501_20120508_apo_ap01_00_hhz.jpg" alt="Album track cover: DOY 125 - Stefan Mertl - Glacioburst Sounds" />
    
    <div id="mrap-trackinfo-1" class="track-info">
        <div id="mrap-current-title-1" class="title">DOY 125</div>
        <div id="mrap-current-artist-1" class="artist">Stefan Mertl</div>
        <div id="mrap-current-album-1" class="album">Glacioburst Sounds</div>
        <div id="mrap-current-description-1" class="description">This is a quiet day in the beginning of May. The seismic activity of the glacier is low.</div>
    </div>
    <audio id="mrap-audio-1" controls="controls" preload="auto">
        <source src="/assets/audio/maar_records/glacioburst_sounds/gb_sounds_doy_125.mp3" type="audio/mp3" />&lt;/source&gt;
        Your browser doesn't support the audio player.
    </audio>
    <ul id="mrap-playlist-1" class="playlist custom-counter">
        
            <li id="mrap-trackitem-1-1">
                <div class="track">
                    <div id="mrap-trackplay-1-1" class="track-play" data-url="/assets/audio/maar_records/glacioburst_sounds/gb_sounds_doy_125.mp3" data-title="DOY 125" data-artist="Stefan Mertl" data-album="Glacioburst Sounds" data-description="This is a quiet day in the beginning of May. The seismic activity of the glacier is low." data-img="/images/maar_records/glacioburst_sounds/doy_125_20120501_20120508_apo_ap01_00_hhz.jpg"><i class="far fa-play-circle"></i></div>
                    <div class="track-info">
                        <div class="title">DOY 125</div>
                        <div class="artist">Stefan Mertl</div>
                        
                           <div class="license no-bubble"><a href="http://creativecommons.org/licenses/by-sa/4.0/" target="_blank"><img src="https://www.mertl-research.at/assets/img/license/cc_by_sa_small.png" title="cc-by-sa" /></a></div>
                        
                        
                           <div class="download no-bubble"><a download="" href="/assets/audio/maar_records/glacioburst_sounds/gb_sounds_doy_125.mp3" title="download"><i class="fas fa-download"></i></a></div>
                        
                    </div>
                </div>
            </li>

        
            <li id="mrap-trackitem-1-2">
                <div class="track">
                    <div id="mrap-trackplay-1-2" class="track-play" data-url="/assets/audio/maar_records/glacioburst_sounds/gb_sounds_doy_153.mp3" data-title="DOY 153" data-artist="Stefan Mertl" data-album="Glacioburst Sounds" data-description="This day includes a significant change of seismic activity. Arround 12:00 UTC, a phase of high seismic activity is initiated by some large events. One can hear the rise of the seismic energy in the high frequency range. This high frequency content is mainly created by many icequakes with a short duration of 1-2 seconds." data-img="/images/maar_records/glacioburst_sounds/doy_153_20120529_20120605_apo_ap01_00_hhz.jpg"><i class="far fa-play-circle"></i></div>
                    <div class="track-info">
                        <div class="title">DOY 153</div>
                        <div class="artist">Stefan Mertl</div>
                        
                           <div class="license no-bubble"><a href="http://creativecommons.org/licenses/by-sa/4.0/" target="_blank"><img src="https://www.mertl-research.at/assets/img/license/cc_by_sa_small.png" title="cc-by-sa" /></a></div>
                        
                        
                           <div class="download no-bubble"><a download="" href="/assets/audio/maar_records/glacioburst_sounds/gb_sounds_doy_153.mp3" title="download"><i class="fas fa-download"></i></a></div>
                        
                    </div>
                </div>
            </li>

        
            <li id="mrap-trackitem-1-3">
                <div class="track">
                    <div id="mrap-trackplay-1-3" class="track-play" data-url="/assets/audio/maar_records/glacioburst_sounds/gb_sounds_doy_219.mp3" data-title="DOY 219" data-artist="Stefan Mertl" data-album="Glacioburst Sounds" data-description="At this day the glacier lake outburst flood happened. It is clearly heard by an increase of low- and high-frequency sound with a fast fallback to a different, still strong, sound pattern." data-img="/images/maar_records/glacioburst_sounds/doy_219_20120731_20120807_apo_ap01_00_hhz.jpg"><i class="far fa-play-circle"></i></div>
                    <div class="track-info">
                        <div class="title">DOY 219</div>
                        <div class="artist">Stefan Mertl</div>
                        
                           <div class="license no-bubble"><a href="http://creativecommons.org/licenses/by-sa/4.0/" target="_blank"><img src="https://www.mertl-research.at/assets/img/license/cc_by_sa_small.png" title="cc-by-sa" /></a></div>
                        
                        
                           <div class="download no-bubble"><a download="" href="/assets/audio/maar_records/glacioburst_sounds/gb_sounds_doy_219.mp3" title="download"><i class="fas fa-download"></i></a></div>
                        
                    </div>
                </div>
            </li>

        
            <li id="mrap-trackitem-1-4">
                <div class="track">
                    <div id="mrap-trackplay-1-4" class="track-play" data-url="/assets/audio/maar_records/glacioburst_sounds/gb_sounds_doy_243.mp3" data-title="DOY 243" data-artist="Stefan Mertl" data-album="Glacioburst Sounds" data-description="This day includes a strong earthquake recorded with the GlacioBurst network. The earthquake dominates the sound with strong low-frequency content." data-img="/images/maar_records/glacioburst_sounds/doy_243_20120828_20120904_apo_ap01_00_hhz.jpg"><i class="far fa-play-circle"></i></div>
                    <div class="track-info">
                        <div class="title">DOY 243</div>
                        <div class="artist">Stefan Mertl</div>
                        
                           <div class="license no-bubble"><a href="http://creativecommons.org/licenses/by-sa/4.0/" target="_blank"><img src="https://www.mertl-research.at/assets/img/license/cc_by_sa_small.png" title="cc-by-sa" /></a></div>
                        
                        
                           <div class="download no-bubble"><a download="" href="/assets/audio/maar_records/glacioburst_sounds/gb_sounds_doy_243.mp3" title="download"><i class="fas fa-download"></i></a></div>
                        
                    </div>
                </div>
            </li>

        
    </ul>
</div>

<p><br /></p>

<h2 id="m-aar-radio">m-aar Radio</h2>
<p>Die Sonifikation des gesamten Datensatzes ist in einer Endlosschleife im <a href="/posts/_posts/2020-05-04-maar_radio/">m-aar Radio</a> verfügbar.</p>

<h2 id="danke">Danke</h2>
<p>Das Glacioburst Programm wurde von <a href="https://seis-uk.le.ac.uk/" target="blank">https://seis-uk.le.ac.uk/</a> durch die Bereitstellung seismischer Ausrüstung, das <a href="https://eu-interact.org/" target="blank">INTERACT</a> Projekt, das Polarvision Projekt (Austrian Federal Ministry of Science and Research, GZ:37.556/0002-II/4/2010) durch die Bereitstellung der Reisekosten und der <a href="http://g-e-m.dk/gem-localities/zackenberg/" target="blank">Zackenberg Research Station</a> mit einem herzlichen Empfang, logistische Abläufe und einer hervorragend ausgestatteten Werkstatt unterstützt.</p>

<h2 id="referenzen">Referenzen</h2>
<ol class="bibliography"><li><div class="text-justify"><span id="callaghan_interact_2017">T. V. Callaghan, H. Savela, Seventh Framework Programme (European Commission), DCE - Nationalt Center for Miljø og Energi, and Interact (Organization), <i>INTERACT: stories of Arctic science</i>. 2017.</span></div>


<a href="https://eu-interact.org/publication/1349/">https://eu-interact.org/publication/1349/</a><br />


<a id="acallaghan_interact_2017" style="display: none;">
<pre>@book{callaghan_interact_2017,
  title = {INTERACT: stories of Arctic science},
  isbn = {978-87-93129-11-5},
  url = {https://eu-interact.org/publication/1349/},
  shorttitle = {{INTERACT}},
  pagetotal = {184},
  author = {Callaghan, T. V and Savela, Hannele and {Seventh Framework Programme (European Commission)} and {DCE - Nationalt Center for Miljø og Energi} and {Interact (Organization)}},
  year = {2017},
  langid = {english},
  note = {OCLC: 1057268595},
  file = {Callaghan et al. - 2017 - INTERACT stories of Arctic science.pdf:/home/stefan/01_gtd/05_dokumente/bibliothek/zotero/storage/Q55CLX88/Callaghan et al. - 2017 - INTERACT stories of Arctic science.pdf:application/pdf}
}
</pre>
</a>
<script>
function toggleBibtexcallaghan_interact_2017(parameter) {
    var x= document.getElementById('acallaghan_interact_2017');
    if (x.style.display === 'none') {
        x.style.display = 'block';
    } else {
        x.style.display = 'none';
    }
}
</script>
</li>
<li><div class="text-justify"><span id="mcgee_musification_2016">R. McGee and D. Rogers, “Musification of Seismic Data,” in <i>Proceedings of the 22nd International Conference on Auditory Display - ICAD 2016</i>, 2016-07, pp. 201–204.</span></div>

<a href="http://doi.org/10.21785/icad2016.021" target="_blank">http://doi.org/10.21785/icad2016.021</a>


<a href="http://hdl.handle.net/1853/56569">http://hdl.handle.net/1853/56569</a><br />


<a id="amcgee_musification_2016" style="display: none;">
<pre>@inproceedings{mcgee_musification_2016,
  location = {Canberra, Australia},
  title = {Musification of Seismic Data},
  isbn = {978-0-9670904-3-6},
  url = {http://hdl.handle.net/1853/56569},
  doi = {10.21785/icad2016.021},
  eventtitle = {The 22nd International Conference on Auditory Display},
  pages = {201--204},
  booktitle = {Proceedings of the 22nd International Conference on Auditory Display - {ICAD} 2016},
  publisher = {The International Community for Auditory Display},
  author = {McGee, Ryan and Rogers, David},
  urldate = {2019-10-04},
  year = {2016-07},
  langid = {english},
  file = {McGee und Rogers - 2016 - Musification of Seismic Data.pdf:/home/stefan/01_gtd/05_dokumente/bibliothek/zotero/storage/XRTVXJTR/McGee und Rogers - 2016 - Musification of Seismic Data.pdf:application/pdf}
}
</pre>
</a>
<script>
function toggleBibtexmcgee_musification_2016(parameter) {
    var x= document.getElementById('amcgee_musification_2016');
    if (x.style.display === 'none') {
        x.style.display = 'block';
    } else {
        x.style.display = 'none';
    }
}
</script>
</li>
<li><div class="text-justify"><span id="mcnamara_ambient_2004">D. E. McNamara and R. P. Buland, “Ambient Noise Levels in the Continental United States,” <i>Bulletin of the Seismological Society of America</i>, vol. 94, no. 4, pp. 1517–1527, 2004.</span></div>

<a href="http://doi.org/10.1785/012003001" target="_blank">http://doi.org/10.1785/012003001</a>


<a href="http://www.bssaonline.org/content/94/4/1517.abstract">http://www.bssaonline.org/content/94/4/1517.abstract</a><br />


<a id="amcnamara_ambient_2004" style="display: none;">
<pre>@article{mcnamara_ambient_2004,
  title = {Ambient Noise Levels in the Continental United States},
  volume = {94},
  url = {http://www.bssaonline.org/content/94/4/1517.abstract},
  doi = {10.1785/012003001},
  pages = {1517--1527},
  number = {4},
  journaltitle = {Bulletin of the Seismological Society of America},
  author = {McNamara, Daniel E. and Buland, Raymond P.},
  year = {2004},
  file = {mcnamara_buland_2004_ambient_noise_levels_in_the_continental_united_states.pdf:/home/stefan/01_gtd/05_dokumente/bibliothek/zotero/storage/TXUJREZB/mcnamara_buland_2004_ambient_noise_levels_in_the_continental_united_states.pdf:application/pdf}
}
</pre>
</a>
<script>
function toggleBibtexmcnamara_ambient_2004(parameter) {
    var x= document.getElementById('amcnamara_ambient_2004');
    if (x.style.display === 'none') {
        x.style.display = 'block';
    } else {
        x.style.display = 'none';
    }
}
</script>
</li>
<li><div class="text-justify"><span id="scales_what_1998">J. A. Scales and R. Snieder, “What is noise?,” <i>Geophysics</i>, vol. 63, no. 4, pp. 1122–1124, 1998.</span></div>


<a id="ascales_what_1998" style="display: none;">
<pre>@article{scales_what_1998,
  title = {What is noise?},
  volume = {63},
  pages = {1122--1124},
  number = {4},
  journaltitle = {Geophysics},
  author = {Scales, John A. and Snieder, Roel},
  year = {1998},
  file = {scales_snieder_1998_what_is_noise.pdf:/home/stefan/01_gtd/05_dokumente/bibliothek/zotero/storage/6KA5UGA4/scales_snieder_1998_what_is_noise.pdf:application/pdf}
}
</pre>
</a>
<script>
function toggleBibtexscales_what_1998(parameter) {
    var x= document.getElementById('ascales_what_1998');
    if (x.style.display === 'none') {
        x.style.display = 'block';
    } else {
        x.style.display = 'none';
    }
}
</script>
</li>
<li><div class="text-justify"><span id="schwarz_state_2011">D. Schwarz, “State of the Art in Sound Texture Synthesis,” in <i>Proc. of the 14 th Int. Conference on Digital Audio Effects (DAFx-11)</i>, 2011, p. 12.</span></div>


<a id="aschwarz_state_2011" style="display: none;">
<pre>@inproceedings{schwarz_state_2011,
  location = {Paris},
  title = {State of the Art in Sound Texture Synthesis},
  eventtitle = {14 th Int. Conference on Digital Audio Effects ({DAFx}-11)},
  pages = {12},
  booktitle = {Proc. of the 14 th Int. Conference on Digital Audio Effects ({DAFx}-11)},
  author = {Schwarz, Diemo},
  year = {2011},
  langid = {english},
  file = {Schwarz - 2011 - State of the Art in Sound Texture Synthesis.pdf:/home/stefan/01_gtd/05_dokumente/bibliothek/zotero/storage/CLWCX8YP/Schwarz - 2011 - State of the Art in Sound Texture Synthesis.pdf:application/pdf}
}
</pre>
</a>
<script>
function toggleBibtexschwarz_state_2011(parameter) {
    var x= document.getElementById('aschwarz_state_2011');
    if (x.style.display === 'none') {
        x.style.display = 'block';
    } else {
        x.style.display = 'none';
    }
}
</script>
</li></ol>]]></content><author><name>Stefan Mertl</name></author><category term="seismogroovebox" /><summary type="html"><![CDATA[Im Jahr 2012 nahm ich an einem Forschungsprojekt mit dem Namen GlacioBurst teil, das die Beobachtung eines Gletscherseeausbruchs eines Auslassgletschers des A.P.Olsen Eisschilds in Grönland zum Ziel hatte. In einem vom Gletscher blockiertem Tal bildet sich während der Schmelzperiode ein See. Der sich zunehmend füllende See (wir bezeichnen ihn als A.P.Olsen See) entleert sich abrupt innerhalb weniger Stunden in einem mehr oder weniger regelmäßigem jährlichen Intervall. Dieser Gletscherseeausbruch erzeugt eine Überflutung im Bereich flussabwärts des Gletscherabflusses, an welchem sich auch die Forschungsstation Zackenberg befindet. Der Gletscherseeausbruch findet üblicherweise im Herbst statt, obwohl auch schon Abweichungen von diesem Muster mit Ausbrüchen im Sommer oder Frühling beobachtet wurden. Während unseres Aufenthalts im Frühling 2012 in Grönland haben wir ein seismisches- und geodätisches Monitoring Netzwerk auf dem Gletscher installiert, um den vollständigen Füll- und Ausbruchszyklus des vom Gletscher blockierten Sees aufzunehmen. Eine kurze Beschreibung unseres Projekts ist im Artikel “INTERACT: stories of Arctic science” [5, p. 42] zu finden. Das seismische Monitoring Netzwerk auf dem Ausflussgletscher des A.P.Olsen Eisschilds. Es besteht aus fünf Stationen mit seismischen und globales Navigationssatellitensystem (GNSS) Messgeräten direkt auf dem Gletscher und einer GNSS Basisstation beim Fuß des Gletschers. Während unserer Feldarbeiten auf dem Gletscher mussten wir einige vertikale, 1 bis 2 Meter tiefe Schneelöcher graben, um das Eis des Gletschers zu erreichen. Während ich in einem dieser Löcher stand bemerkte ich plötzlich, dass absolute Stille herrschte. Ich habe diese Erfahrung zuvor noch nie in einer freien, natürlichen Umgebung gemacht. Normalerweise, wenn man sich an einem Ort befindet den man als sehr ruhig empfindet, sind immer noch natürliche oder vom Menschen erzeugte Geräusche wahrzunehmen. Aber dieses Mal im Schneeloch in Grönland hörte ich nichts, keine Windgeräusche, kein plätscherndes Wasser, kein Rascheln der Vegetation, keine Tiere, kein menschlich erzeugtes Geräusch, nicht einmal Flugzeuge - einfach Stille. Dieses Erlebnis ließ mich an all die möglichen akustischen Quellen denken, die an dem Ort noch immer präsent waren, aber einfach zu leise sind um von mir gehört zu werden. Als Seismologe wusste ich, dass das Eis unter mir voll von akustischen Wellen war. Die meisten dieser Wellen haben entweder zu geringe Amplituden und/oder zu geringe Frequenzen, um vom Menschen gehört zu werden. Was für eine Geräuschkulisse würden all die seismischen Wellen wohl erzeugen? Es gab schon etliche Menschen, die sich auf die Suche nach dem Klang seismischer Aufzeichnungen machten. Beispiele dafür sind seismicsoundslab, Beneath and Beyound: Seismic Sounds oder SeismicSounds on Soundcloud. Ein gängiger Ansatz, um die tiefen Frequenzen seismischer Signale in den hörbaren Bereich zu transformieren, ist das beschleunigte Abspielen der Seismogramme. Diese Zeitkomprimierung bewahrt die Charakterisitk des Frequenzspektrums, das zeitliche Verhalten geht allerdings verloren. Eine andere Methode ist das Pitch-Shifting der seismischen Aufzeichnungen mit Hilfe eines Phase-Vocoders oder granularer Synthese. Bei seismischen Signalen ist normalerweise eine Erhöhung der Frequenz um einige Oktaven notwendig, was normalerweise den Klang stark durch berechnungs-basierte Artefakte verändert [5]. Diese Artefakte können allerdings auch zu einem Bestandteil des Klang-Designs oder der Komposition werden. Neben der Audifikation von Seismogrammen ist das Parameter-Mapping eine weit verbreitete Methode, um die Bodenbewegung in Geräusche und Klänge zu übersetzen (z.B. Fault Trace). Bei dieser Methode werden charakteristische Eigenschaften der Quelldaten Parametern, die den Klang beschreiben (z.B. Tonhöhe, Lautstärke, Frequenz, …) zugeordnet. Der Datensatz, den wir auf dem grönländischen Gletscher aufgezeichnet haben umspannt 6 Monate von Mai bis Oktober 2012. Eine Standardmethode bei der Analyse seismischer Zeitreihen ist die Berechnung von Spektrogrammen und der Probability Power Spectral Density [5]. Damit erhält man einen guten Überblick über das grundlegende Verhalten des seismischen Hintergrundrauschens und von Perioden, bei denen sich der Frequenzinhalt der seismischen Signale signifikant vom diesem unterscheidet. Die Methoden liefern auch eine gute zeitliche Komprimierung ohne den Verlust wichtiger Informationen. Große Datenmengen können demnach sehr schnell nach Phasen von speziellem seismologischem Interesse durchsucht werden. Spektrogramm einer Woche der seismischen Daten, die an der Station AP01 aufgezeichnet wurden. Links ist der zeitliche Mittelwert des Spektrogramms mit den Standard Rauchmodellen nach Peterson (graue Linien) dargestellt. Das oben dargestellte Spektrogramm hebt die Stärken dieser Langzeit Spektrogramme hervor. Einige Muster stechen sofort hervor. Die beiden breitbandigen, scharfen vertikalen Linien gleich nach den Stunden 60 und 84 mit hoher Energie bis weit in die tiefen Frequenzen markieren zwei starke Erdbeben (Mw = 6.6 und Mb = 5.3) mit einem Epizentrum in der Nähen der Jan Mayen Inseln. Mehrere folgende ähnliche Signale, aber nicht mit einem vergleichbar starkem Anteil niederfrequenter Signalinhalte, markieren Nachbeben des Jan Mayen Hauptbebens. Weiters ist im Frequenzbereich über 4 Hz das Auftreten von täglichen Mustern im seismischen Rauschen zu erkennen. Ein genauerer Blick in die seismischen Daten zeigte, dass dieses Rauschen durch eine große Anzahl von Eisbeben innerhalb kurzer Zeitintervallen (kleiner einiger Sekunden) erzeugt wurde. Das führt sofort zu der Frage: “Was ist das Rauschen?”. Nach Scales und Snieder [5], ist das Rauschen der Teil der Daten, den wir nicht versuchen zu erklären. Das Rauschen ist also der Signalanteil, der den Beobachter nicht interessiert und der ihn bei der Suche nach seinen Signalen eventuell stören kann. Dieser sehr subjektive Ansatz spiegelt sich auch in dem zuvor beschriebenem täglichen Muster wieder, bei dem der Unterschied zwischen Signal und Rauschen durch den Beobachtungszeitraum und das temporale Auflösungsvermögen bestimmt wird. Die detaillierte Untersuchung des seismischen Hintergrundrauschens führte zu drei Fragen, die ich versuche mit akustischen Methoden zu erforschen: Wie beeinflusst die zeitliche Auflösung die Wahrnehmung von Rauschen? Wann verwandelt sich ein Signal in Rauschen, und wann wird das Rauschen zum Signal? Mein Startpunkt für die Erzeugung einer Klang-Textur [5], die das seismischen Hintergrundrauschen repräsentiert, ist die Sonifikation von seismogrammen. Ich verwende die selbst entwickelte Software psysmon für die Datenanalyse und die Signalverarbeitung, selbst entwickelte Python Skripte für die Vorbereitung der Daten und SuperCollider für die Sonifikation. Mein erster Ansatz für die Sonifikation besteht aus der Erzeugung einer Oszillator-Bank, die auf den lokalen Frequenzspitzen des Energiedichtespecktrums der Seismogramme basiert. Zusätzlich wird das Noise-Shaping weißen Rauschens mit dem Energiedichtespektrum der Seismogramme verwendet, um die Frequenzen der Spektren in den höhrbaren Bereich zu verschieben. Die zeitliche Entwicklung ergibt sich durch den Durchlauf der Frequenzspektren der Spektrogramme. Die Sonifikation erfolgt für jede der 5 Stationen des seismischen Netzwerks einzeln und wird im Stereofeld verteilt. Folgend sind die Sonifikationen von 4 Tagen des GlacioBurst Datensatzes zu finden. Die Bilder der einzelnen Tracks zeigen die Spektrogramme der Station AP01 einer Woche. Die Zeitspanne, die für die Sonifikation verwendet wurde ist in diesen Bildern hervorgehoben. Die ausgewählten Beispiele zeigen charakteristischen Eigenschaften des seismischen Hintergrundrauschens am A.P.Olsen Eisschild Ausflussgletscher und einige herausstechende Ereignisse. Ich empfehle die Verwendung von Kopfhörern für das Anhören der Klangbeispiele. DOY 125 Stefan Mertl Glacioburst Sounds This is a quiet day in the beginning of May. The seismic activity of the glacier is low. &lt;/source&gt; Your browser doesn't support the audio player. DOY 125 Stefan Mertl DOY 153 Stefan Mertl DOY 219 Stefan Mertl DOY 243 Stefan Mertl m-aar Radio Die Sonifikation des gesamten Datensatzes ist in einer Endlosschleife im m-aar Radio verfügbar. Danke Das Glacioburst Programm wurde von https://seis-uk.le.ac.uk/ durch die Bereitstellung seismischer Ausrüstung, das INTERACT Projekt, das Polarvision Projekt (Austrian Federal Ministry of Science and Research, GZ:37.556/0002-II/4/2010) durch die Bereitstellung der Reisekosten und der Zackenberg Research Station mit einem herzlichen Empfang, logistische Abläufe und einer hervorragend ausgestatteten Werkstatt unterstützt. Referenzen T. V. Callaghan, H. Savela, Seventh Framework Programme (European Commission), DCE - Nationalt Center for Miljø og Energi, and Interact (Organization), INTERACT: stories of Arctic science. 2017. https://eu-interact.org/publication/1349/ @book{callaghan_interact_2017, title = {INTERACT: stories of Arctic science}, isbn = {978-87-93129-11-5}, url = {https://eu-interact.org/publication/1349/}, shorttitle = {{INTERACT}}, pagetotal = {184}, author = {Callaghan, T. V and Savela, Hannele and {Seventh Framework Programme (European Commission)} and {DCE - Nationalt Center for Miljø og Energi} and {Interact (Organization)}}, year = {2017}, langid = {english}, note = {OCLC: 1057268595}, file = {Callaghan et al. - 2017 - INTERACT stories of Arctic science.pdf:/home/stefan/01_gtd/05_dokumente/bibliothek/zotero/storage/Q55CLX88/Callaghan et al. - 2017 - INTERACT stories of Arctic science.pdf:application/pdf} } R. McGee and D. Rogers, “Musification of Seismic Data,” in Proceedings of the 22nd International Conference on Auditory Display - ICAD 2016, 2016-07, pp. 201–204. http://doi.org/10.21785/icad2016.021 http://hdl.handle.net/1853/56569 @inproceedings{mcgee_musification_2016, location = {Canberra, Australia}, title = {Musification of Seismic Data}, isbn = {978-0-9670904-3-6}, url = {http://hdl.handle.net/1853/56569}, doi = {10.21785/icad2016.021}, eventtitle = {The 22nd International Conference on Auditory Display}, pages = {201--204}, booktitle = {Proceedings of the 22nd International Conference on Auditory Display - {ICAD} 2016}, publisher = {The International Community for Auditory Display}, author = {McGee, Ryan and Rogers, David}, urldate = {2019-10-04}, year = {2016-07}, langid = {english}, file = {McGee und Rogers - 2016 - Musification of Seismic Data.pdf:/home/stefan/01_gtd/05_dokumente/bibliothek/zotero/storage/XRTVXJTR/McGee und Rogers - 2016 - Musification of Seismic Data.pdf:application/pdf} } D. E. McNamara and R. P. Buland, “Ambient Noise Levels in the Continental United States,” Bulletin of the Seismological Society of America, vol. 94, no. 4, pp. 1517–1527, 2004. http://doi.org/10.1785/012003001 http://www.bssaonline.org/content/94/4/1517.abstract @article{mcnamara_ambient_2004, title = {Ambient Noise Levels in the Continental United States}, volume = {94}, url = {http://www.bssaonline.org/content/94/4/1517.abstract}, doi = {10.1785/012003001}, pages = {1517--1527}, number = {4}, journaltitle = {Bulletin of the Seismological Society of America}, author = {McNamara, Daniel E. and Buland, Raymond P.}, year = {2004}, file = {mcnamara_buland_2004_ambient_noise_levels_in_the_continental_united_states.pdf:/home/stefan/01_gtd/05_dokumente/bibliothek/zotero/storage/TXUJREZB/mcnamara_buland_2004_ambient_noise_levels_in_the_continental_united_states.pdf:application/pdf} } J. A. Scales and R. Snieder, “What is noise?,” Geophysics, vol. 63, no. 4, pp. 1122–1124, 1998. @article{scales_what_1998, title = {What is noise?}, volume = {63}, pages = {1122--1124}, number = {4}, journaltitle = {Geophysics}, author = {Scales, John A. and Snieder, Roel}, year = {1998}, file = {scales_snieder_1998_what_is_noise.pdf:/home/stefan/01_gtd/05_dokumente/bibliothek/zotero/storage/6KA5UGA4/scales_snieder_1998_what_is_noise.pdf:application/pdf} } D. Schwarz, “State of the Art in Sound Texture Synthesis,” in Proc. of the 14 th Int. Conference on Digital Audio Effects (DAFx-11), 2011, p. 12. @inproceedings{schwarz_state_2011, location = {Paris}, title = {State of the Art in Sound Texture Synthesis}, eventtitle = {14 th Int. Conference on Digital Audio Effects ({DAFx}-11)}, pages = {12}, booktitle = {Proc. of the 14 th Int. Conference on Digital Audio Effects ({DAFx}-11)}, author = {Schwarz, Diemo}, year = {2011}, langid = {english}, file = {Schwarz - 2011 - State of the Art in Sound Texture Synthesis.pdf:/home/stefan/01_gtd/05_dokumente/bibliothek/zotero/storage/CLWCX8YP/Schwarz - 2011 - State of the Art in Sound Texture Synthesis.pdf:application/pdf} }]]></summary><media:thumbnail xmlns:media="http://search.yahoo.com/mrss/" url="https://www.mertl-research.at/%7B%22homepage%22=%3E%22snow_landscape.jpg%22,%20%22featured%22=%3E%22frontpage.jpg%22%7D" /><media:content medium="image" url="https://www.mertl-research.at/%7B%22homepage%22=%3E%22snow_landscape.jpg%22,%20%22featured%22=%3E%22frontpage.jpg%22%7D" xmlns:media="http://search.yahoo.com/mrss/" /></entry><entry xml:lang="en"><title type="html">Listen to Seismic Noise</title><link href="https://www.mertl-research.at/en/seismogroovebox/sonification_of_ambient_seismic_noise/" rel="alternate" type="text/html" title="Listen to Seismic Noise" /><published>2019-10-17T00:00:00+02:00</published><updated>2019-10-17T00:00:00+02:00</updated><id>https://www.mertl-research.at/en/seismogroovebox/sonification_of_ambient_seismic_noise</id><content type="html" xml:base="https://www.mertl-research.at/en/seismogroovebox/sonification_of_ambient_seismic_noise/"><![CDATA[<p>Back in 2012, I took part in a research project called GlacioBurst to monitor a
glacier lake outburst flood at an <a href="https://www.openstreetmap.org/search?query=74.6378N%2C%20-21.4196W#map=10/74.6224/-21.4343" target="blank">outlet glacier</a> of the
A.P.Olsen ice cap in Greenland. A valley blocked by the glacier fills up with
water during the melting period. The growing lake in the valley (we named it
Lake A.P. Olsen) is suddenly emptied within some hours in a more or less yearly
interval, creating a glacier lake outburst flood downstream. The outburst
flood usually happens sometime in autumn, although variations from this
regularity with floodings in summer or spring have also been observed. We have
installed a seismic- and deformation monitoring network on the glacier to
capture the complete fill- and drain cycle of the glacier dammed lake. See an article in the book
“INTERACT: stories of Arctic science” <a class="citation" href="#callaghan_interact_2017">[1, p. 42]</a>
for a short description of the project.</p>

<div style="padding-bottom: 1.25rem; text-align: center;">
<a href="/images/posts/2019/2019-10-17/apo_monitoring_network.jpg" data-featherlight="image" caption="The seismic monitoring network at the outlet glacier of the A.P.Olsen ice cap consisting of five seismic and global navigation satellite system (GNSS) stations on the glacier and one GNSS base station at the glacier front.">
<img src="/images/posts/2019/2019-10-17/apo_monitoring_network.jpg" alt="The seismic monitoring network at the outlet glacier of the A.P.Olsen ice cap consisting of five seismic and global navigation satellite system (GNSS) stations on the glacier and one GNSS base station at the glacier front." />
</a>


<figcaption class="center-caption">
    The seismic monitoring network at the outlet glacier of the A.P.Olsen ice cap consisting of five seismic and global navigation satellite system (GNSS) stations on the glacier and one GNSS base station at the glacier front.
</figcaption>


</div>

<p>During our field work we had to dig many vertical, 1 to 2 meter deep
snow-pits to reach the ice of the glacier. While standing in one of the holes
I suddenly realized, that there was absolute silence. I have never experienced
something like that in an open, natural environment.  Usually if you are in a
place where you think it’s very quiet, there is still some sound to hear from
either a natural or an anthropogenic source. But that time in Greenland there
was nothing to hear, no wind blowing, no water rippling, no rustling from vegetation, no animals,
no man-made sound, even no airplanes - nothing.</p>

<div style="padding-bottom: 1.25rem; text-align: center;">
<a href="/images/posts/2019/2019-10-17/snow_pit.jpg" data-featherlight="image">
<img src="/images/posts/2019/2019-10-17/snow_pit.jpg" />
</a>


</div>

<p>This made me think about all the possible sound sources still present but which
we just can’t hear. As a seismologist, I knew, that the ground below me is
filled with acoustic waves. Most of these waves have either too weak amplitudes and/or too
low frequencies to be heard. What soundscape would be created by all these
seismic waves?</p>

<div style="padding-bottom: 1.25rem; text-align: center;">
<a href="/images/posts/2019/2019-10-17/snow_landscape.jpg" data-featherlight="image">
<img src="/images/posts/2019/2019-10-17/snow_landscape.jpg" />
</a>


</div>

<p>There already have been some people searching for the sound of seismic
recordings. See <a href="http://www.seismicsoundlab.org/" target="blank">seismicsoundslab</a>, <a href="http://www.seismicsounds.net/" target="blank">Beneath and Beyound:
Seismic Sounds</a> or <a href="https://soundcloud.com/seismicsounds">SeismicSounds on
Soundcloud</a> for some examples. One common approach is to
speed up the recorded seismograms to transform the signal to the audible
frequency range. This preserves the characteristics of the frequency spectrum
but the temporal behaviour is lost. Another method is pitch-shifting the
seismic recordings to the audible range using a phase vocoder or granular
synthesis.  Usually a shift of several octaves of a low-frequency signal is
required, which introduces computational artefacts altering the sound
significantly <a class="citation" href="#mcgee_musification_2016">[2]</a>. Nevertheless these effects
can be integral parts of the sound design or composition. Besides
<a href="https://en.wikipedia.org/wiki/Audification" target="blank">audification</a> of the seismograms, parameter mapping is a
widely used method for translating ground motion into sound (e.g. <a href="https://fault-trace.bandcamp.com/album/2017" target="blank">Fault
Trace</a>). With this method, characteristic features of the
source data are mapped to features describing a sound (e.g. pitch, loudness,
tone, …).</p>

<p>The dataset recorded on the Greenland glacier spans 6 months from May 2012 to
October 2012. A standard
procedure when analyzing the seismic data is to compute a spectrogram and the
probability power spectral density of the recorded data <a class="citation" href="#mcnamara_ambient_2004">[3]</a>. This gives a good overview of the general behaviour
of the ambient seismic noise and periods with changes in the frequency or
amplitude characteristics can be easily identified. It also provides a good
temporal compression without loosing significant information and large datasets
can be screened very fast for phases of special interest.</p>

<div style="padding-bottom: 1.25rem; text-align: center;">
<a href="/images/posts/2019/2019-10-17/20120828_20120904_apo_ap01_00_hhz.png" data-featherlight="image" caption="Spectrogram of one
week of seismic data recorded at station AP01. On the left, the temporal
average of the spectrogram is plotted with the standard seismic noise models
(grey lines) as a reference.">
<img src="/images/posts/2019/2019-10-17/20120828_20120904_apo_ap01_00_hhz.png" alt="Spectrogram of one
week of seismic data recorded at station AP01. On the left, the temporal
average of the spectrogram is plotted with the standard seismic noise models
(grey lines) as a reference." />
</a>


<figcaption class="center-caption">
    Spectrogram of one
week of seismic data recorded at station AP01. On the left, the temporal
average of the spectrogram is plotted with the standard seismic noise models
(grey lines) as a reference.
</figcaption>


</div>

<p>The spectrogram shown above highlights the strength of these long-term
spectrograms. Immediately several patterns can be seen. The two spikes right after the hours
60 and 84 with large energy down to very low frequencies, mark two strong
earthquakes (<a href="https://www.seismicportal.eu/eventdetails.html?unid=20120830_0000050#originsSection" target="blank">Mw = 6.6</a> and <a href="https://www.seismicportal.eu/eventdetails.html?unid=20120830_0000053" target="blank">Mb = 5.3</a>)
with an origin close to the <a href="https://en.wikipedia.org/wiki/Jan_Mayen" target="blank">Jan Mayen island</a>. Several subsequent similar spikes, but not
with that strong low frequency content mark aftershocks of the Jan Mayen main
shock. The transition of the noise above 4 Hz to a diurnal pattern can be seen
as well. A closer look into the seismograms shows, that this noise is comprised
by many short icequakes occurring at short intervals (&lt; several seconds). This
immediately leads to the question: “What is noise?”. Following Scales and
Snieder <a class="citation" href="#scales_what_1998">[4]</a>, noise is that part of data, that we try not to explain. This very subjective approach is also reflected in the diurnal pattern described above, where the distinction between signal and noise depends on the observational period.</p>

<p>The detailed investigation of the ambient seismic noise lead to three
questions, that I’m trying to explore in the acoustic domain using sound-design
and musical methods: How does temporal resolution affect the perception of
noise, when turns signal into noise and when does noise transform into rhythm?</p>

<p>My starting point is the sonification of the spectrograms to create a sound
texture <a class="citation" href="#schwarz_state_2011">[5]</a> representing ambient seismic noise. I’m
using my custom written software <a href="/projects/psysmon" target="blank">psysmon</a> for data
analysis and preprocessing, custom <a href="https://www.python.org/" target="blank">Python</a> scripts for
data preparation and <a href="https://supercollider.github.io/" target="blank">SuperCollider</a> for the sonification.</p>

<p>My first sonification approach consists of the creation of oscillator banks
based on the peak frequencies of the power spectral density and a shaping of
white noise using the power spectral density. The temporal evolution is created
by traversing the power spectral densities of the spectrogram. Each seismic
station is sonified individually and spread across the stereo field.</p>

<p>Below you find the sonification of four days of the GlacioBurst dataset. The
image related to each track shows the power spectral density of station AP01 of
one week. The time-span used for the sonification is highlighted. The selected
examples show characteristic features of the ambient seismic noise conditions
at the A.P.Olsen ice cap outlet glacier and some outstanding events.</p>

<p><em>I recommend using headphones for listening.</em></p>

<div id="mr-audioplayer-1" class="audio-player-wrapper">
    
       <img class="audio-player-cover" id="mrap-current-cover-1" src="/images/maar_records/glacioburst_sounds/doy_125_20120501_20120508_apo_ap01_00_hhz.jpg" alt="Album track cover: DOY 125 - Stefan Mertl - Glacioburst Sounds" />
    
    <div id="mrap-trackinfo-1" class="track-info">
        <div id="mrap-current-title-1" class="title">DOY 125</div>
        <div id="mrap-current-artist-1" class="artist">Stefan Mertl</div>
        <div id="mrap-current-album-1" class="album">Glacioburst Sounds</div>
        <div id="mrap-current-description-1" class="description">This is a quiet day in the beginning of May. The seismic activity of the glacier is low.</div>
    </div>
    <audio id="mrap-audio-1" controls="controls" preload="auto">
        <source src="/assets/audio/maar_records/glacioburst_sounds/gb_sounds_doy_125.mp3" type="audio/mp3" />&lt;/source&gt;
        Your browser doesn't support the audio player.
    </audio>
    <ul id="mrap-playlist-1" class="playlist custom-counter">
        
            <li id="mrap-trackitem-1-1">
                <div class="track">
                    <div id="mrap-trackplay-1-1" class="track-play" data-url="/assets/audio/maar_records/glacioburst_sounds/gb_sounds_doy_125.mp3" data-title="DOY 125" data-artist="Stefan Mertl" data-album="Glacioburst Sounds" data-description="This is a quiet day in the beginning of May. The seismic activity of the glacier is low." data-img="/images/maar_records/glacioburst_sounds/doy_125_20120501_20120508_apo_ap01_00_hhz.jpg"><i class="far fa-play-circle"></i></div>
                    <div class="track-info">
                        <div class="title">DOY 125</div>
                        <div class="artist">Stefan Mertl</div>
                        
                           <div class="license no-bubble"><a href="http://creativecommons.org/licenses/by-sa/4.0/" target="_blank"><img src="https://www.mertl-research.at/assets/img/license/cc_by_sa_small.png" title="cc-by-sa" /></a></div>
                        
                        
                           <div class="download no-bubble"><a download="" href="/assets/audio/maar_records/glacioburst_sounds/gb_sounds_doy_125.mp3" title="download"><i class="fas fa-download"></i></a></div>
                        
                    </div>
                </div>
            </li>

        
            <li id="mrap-trackitem-1-2">
                <div class="track">
                    <div id="mrap-trackplay-1-2" class="track-play" data-url="/assets/audio/maar_records/glacioburst_sounds/gb_sounds_doy_153.mp3" data-title="DOY 153" data-artist="Stefan Mertl" data-album="Glacioburst Sounds" data-description="This day includes a significant change of seismic activity. Arround 12:00 UTC, a phase of high seismic activity is initiated by some large events. One can hear the rise of the seismic energy in the high frequency range. This high frequency content is mainly created by many icequakes with a short duration of 1-2 seconds." data-img="/images/maar_records/glacioburst_sounds/doy_153_20120529_20120605_apo_ap01_00_hhz.jpg"><i class="far fa-play-circle"></i></div>
                    <div class="track-info">
                        <div class="title">DOY 153</div>
                        <div class="artist">Stefan Mertl</div>
                        
                           <div class="license no-bubble"><a href="http://creativecommons.org/licenses/by-sa/4.0/" target="_blank"><img src="https://www.mertl-research.at/assets/img/license/cc_by_sa_small.png" title="cc-by-sa" /></a></div>
                        
                        
                           <div class="download no-bubble"><a download="" href="/assets/audio/maar_records/glacioburst_sounds/gb_sounds_doy_153.mp3" title="download"><i class="fas fa-download"></i></a></div>
                        
                    </div>
                </div>
            </li>

        
            <li id="mrap-trackitem-1-3">
                <div class="track">
                    <div id="mrap-trackplay-1-3" class="track-play" data-url="/assets/audio/maar_records/glacioburst_sounds/gb_sounds_doy_219.mp3" data-title="DOY 219" data-artist="Stefan Mertl" data-album="Glacioburst Sounds" data-description="At this day the glacier lake outburst flood happened. It is clearly heard by an increase of low- and high-frequency sound with a fast fallback to a different, still strong, sound pattern." data-img="/images/maar_records/glacioburst_sounds/doy_219_20120731_20120807_apo_ap01_00_hhz.jpg"><i class="far fa-play-circle"></i></div>
                    <div class="track-info">
                        <div class="title">DOY 219</div>
                        <div class="artist">Stefan Mertl</div>
                        
                           <div class="license no-bubble"><a href="http://creativecommons.org/licenses/by-sa/4.0/" target="_blank"><img src="https://www.mertl-research.at/assets/img/license/cc_by_sa_small.png" title="cc-by-sa" /></a></div>
                        
                        
                           <div class="download no-bubble"><a download="" href="/assets/audio/maar_records/glacioburst_sounds/gb_sounds_doy_219.mp3" title="download"><i class="fas fa-download"></i></a></div>
                        
                    </div>
                </div>
            </li>

        
            <li id="mrap-trackitem-1-4">
                <div class="track">
                    <div id="mrap-trackplay-1-4" class="track-play" data-url="/assets/audio/maar_records/glacioburst_sounds/gb_sounds_doy_243.mp3" data-title="DOY 243" data-artist="Stefan Mertl" data-album="Glacioburst Sounds" data-description="This day includes a strong earthquake recorded with the GlacioBurst network. The earthquake dominates the sound with strong low-frequency content." data-img="/images/maar_records/glacioburst_sounds/doy_243_20120828_20120904_apo_ap01_00_hhz.jpg"><i class="far fa-play-circle"></i></div>
                    <div class="track-info">
                        <div class="title">DOY 243</div>
                        <div class="artist">Stefan Mertl</div>
                        
                           <div class="license no-bubble"><a href="http://creativecommons.org/licenses/by-sa/4.0/" target="_blank"><img src="https://www.mertl-research.at/assets/img/license/cc_by_sa_small.png" title="cc-by-sa" /></a></div>
                        
                        
                           <div class="download no-bubble"><a download="" href="/assets/audio/maar_records/glacioburst_sounds/gb_sounds_doy_243.mp3" title="download"><i class="fas fa-download"></i></a></div>
                        
                    </div>
                </div>
            </li>

        
    </ul>
</div>

<p><br /></p>

<h2 id="m-aar-radio">m-aar Radio</h2>
<p>The sonification of the complete dataset is available as an infinite loop audio stream at <a href="/en/posts/_posts/2020-05-04-maar_radio/">m-aar Radio</a>.</p>

<h2 id="thanks">Thanks</h2>
<p>The GlacioBurst project was supported by
<a href="https://seis-uk.le.ac.uk/" target="blank">https://seis-uk.le.ac.uk/</a> providing the seismic
equipment and the <a href="https://eu-interact.org/" target="blank">INTERACT</a> project, the Polarvision
project (Austrian Federal Ministry of Science and Research, GZ:
37.556/0002-II/4/2010) covering the travel costs and <a href="http://g-e-m.dk/gem-localities/zackenberg/" target="blank">Zackenberg Research
Station</a> with a warm welcome and logistic infrastructure.</p>

<h2 id="references">References</h2>
<ol class="bibliography"><li><div class="text-justify"><span id="callaghan_interact_2017">T. V. Callaghan, H. Savela, Seventh Framework Programme (European Commission), DCE - Nationalt Center for Miljø og Energi, and Interact (Organization), <i>INTERACT: stories of Arctic science</i>. 2017.</span></div>


<a href="https://eu-interact.org/publication/1349/">https://eu-interact.org/publication/1349/</a><br />


<a id="acallaghan_interact_2017" style="display: none;">
<pre>@book{callaghan_interact_2017,
  title = {INTERACT: stories of Arctic science},
  isbn = {978-87-93129-11-5},
  url = {https://eu-interact.org/publication/1349/},
  shorttitle = {{INTERACT}},
  pagetotal = {184},
  author = {Callaghan, T. V and Savela, Hannele and {Seventh Framework Programme (European Commission)} and {DCE - Nationalt Center for Miljø og Energi} and {Interact (Organization)}},
  year = {2017},
  langid = {english},
  note = {OCLC: 1057268595},
  file = {Callaghan et al. - 2017 - INTERACT stories of Arctic science.pdf:/home/stefan/01_gtd/05_dokumente/bibliothek/zotero/storage/Q55CLX88/Callaghan et al. - 2017 - INTERACT stories of Arctic science.pdf:application/pdf}
}
</pre>
</a>
<script>
function toggleBibtexcallaghan_interact_2017(parameter) {
    var x= document.getElementById('acallaghan_interact_2017');
    if (x.style.display === 'none') {
        x.style.display = 'block';
    } else {
        x.style.display = 'none';
    }
}
</script>
</li>
<li><div class="text-justify"><span id="mcgee_musification_2016">R. McGee and D. Rogers, “Musification of Seismic Data,” in <i>Proceedings of the 22nd International Conference on Auditory Display - ICAD 2016</i>, 2016-07, pp. 201–204.</span></div>

<a href="http://doi.org/10.21785/icad2016.021" target="_blank">http://doi.org/10.21785/icad2016.021</a>


<a href="http://hdl.handle.net/1853/56569">http://hdl.handle.net/1853/56569</a><br />


<a id="amcgee_musification_2016" style="display: none;">
<pre>@inproceedings{mcgee_musification_2016,
  location = {Canberra, Australia},
  title = {Musification of Seismic Data},
  isbn = {978-0-9670904-3-6},
  url = {http://hdl.handle.net/1853/56569},
  doi = {10.21785/icad2016.021},
  eventtitle = {The 22nd International Conference on Auditory Display},
  pages = {201--204},
  booktitle = {Proceedings of the 22nd International Conference on Auditory Display - {ICAD} 2016},
  publisher = {The International Community for Auditory Display},
  author = {McGee, Ryan and Rogers, David},
  urldate = {2019-10-04},
  year = {2016-07},
  langid = {english},
  file = {McGee und Rogers - 2016 - Musification of Seismic Data.pdf:/home/stefan/01_gtd/05_dokumente/bibliothek/zotero/storage/XRTVXJTR/McGee und Rogers - 2016 - Musification of Seismic Data.pdf:application/pdf}
}
</pre>
</a>
<script>
function toggleBibtexmcgee_musification_2016(parameter) {
    var x= document.getElementById('amcgee_musification_2016');
    if (x.style.display === 'none') {
        x.style.display = 'block';
    } else {
        x.style.display = 'none';
    }
}
</script>
</li>
<li><div class="text-justify"><span id="mcnamara_ambient_2004">D. E. McNamara and R. P. Buland, “Ambient Noise Levels in the Continental United States,” <i>Bulletin of the Seismological Society of America</i>, vol. 94, no. 4, pp. 1517–1527, 2004.</span></div>

<a href="http://doi.org/10.1785/012003001" target="_blank">http://doi.org/10.1785/012003001</a>


<a href="http://www.bssaonline.org/content/94/4/1517.abstract">http://www.bssaonline.org/content/94/4/1517.abstract</a><br />


<a id="amcnamara_ambient_2004" style="display: none;">
<pre>@article{mcnamara_ambient_2004,
  title = {Ambient Noise Levels in the Continental United States},
  volume = {94},
  url = {http://www.bssaonline.org/content/94/4/1517.abstract},
  doi = {10.1785/012003001},
  pages = {1517--1527},
  number = {4},
  journaltitle = {Bulletin of the Seismological Society of America},
  author = {McNamara, Daniel E. and Buland, Raymond P.},
  year = {2004},
  file = {mcnamara_buland_2004_ambient_noise_levels_in_the_continental_united_states.pdf:/home/stefan/01_gtd/05_dokumente/bibliothek/zotero/storage/TXUJREZB/mcnamara_buland_2004_ambient_noise_levels_in_the_continental_united_states.pdf:application/pdf}
}
</pre>
</a>
<script>
function toggleBibtexmcnamara_ambient_2004(parameter) {
    var x= document.getElementById('amcnamara_ambient_2004');
    if (x.style.display === 'none') {
        x.style.display = 'block';
    } else {
        x.style.display = 'none';
    }
}
</script>
</li>
<li><div class="text-justify"><span id="scales_what_1998">J. A. Scales and R. Snieder, “What is noise?,” <i>Geophysics</i>, vol. 63, no. 4, pp. 1122–1124, 1998.</span></div>


<a id="ascales_what_1998" style="display: none;">
<pre>@article{scales_what_1998,
  title = {What is noise?},
  volume = {63},
  pages = {1122--1124},
  number = {4},
  journaltitle = {Geophysics},
  author = {Scales, John A. and Snieder, Roel},
  year = {1998},
  file = {scales_snieder_1998_what_is_noise.pdf:/home/stefan/01_gtd/05_dokumente/bibliothek/zotero/storage/6KA5UGA4/scales_snieder_1998_what_is_noise.pdf:application/pdf}
}
</pre>
</a>
<script>
function toggleBibtexscales_what_1998(parameter) {
    var x= document.getElementById('ascales_what_1998');
    if (x.style.display === 'none') {
        x.style.display = 'block';
    } else {
        x.style.display = 'none';
    }
}
</script>
</li>
<li><div class="text-justify"><span id="schwarz_state_2011">D. Schwarz, “State of the Art in Sound Texture Synthesis,” in <i>Proc. of the 14 th Int. Conference on Digital Audio Effects (DAFx-11)</i>, 2011, p. 12.</span></div>


<a id="aschwarz_state_2011" style="display: none;">
<pre>@inproceedings{schwarz_state_2011,
  location = {Paris},
  title = {State of the Art in Sound Texture Synthesis},
  eventtitle = {14 th Int. Conference on Digital Audio Effects ({DAFx}-11)},
  pages = {12},
  booktitle = {Proc. of the 14 th Int. Conference on Digital Audio Effects ({DAFx}-11)},
  author = {Schwarz, Diemo},
  year = {2011},
  langid = {english},
  file = {Schwarz - 2011 - State of the Art in Sound Texture Synthesis.pdf:/home/stefan/01_gtd/05_dokumente/bibliothek/zotero/storage/CLWCX8YP/Schwarz - 2011 - State of the Art in Sound Texture Synthesis.pdf:application/pdf}
}
</pre>
</a>
<script>
function toggleBibtexschwarz_state_2011(parameter) {
    var x= document.getElementById('aschwarz_state_2011');
    if (x.style.display === 'none') {
        x.style.display = 'block';
    } else {
        x.style.display = 'none';
    }
}
</script>
</li></ol>]]></content><author><name>Stefan Mertl</name></author><category term="seismogroovebox" /><summary type="html"><![CDATA[Back in 2012, I took part in a research project called GlacioBurst to monitor a glacier lake outburst flood at an outlet glacier of the A.P.Olsen ice cap in Greenland. A valley blocked by the glacier fills up with water during the melting period. The growing lake in the valley (we named it Lake A.P. Olsen) is suddenly emptied within some hours in a more or less yearly interval, creating a glacier lake outburst flood downstream. The outburst flood usually happens sometime in autumn, although variations from this regularity with floodings in summer or spring have also been observed. We have installed a seismic- and deformation monitoring network on the glacier to capture the complete fill- and drain cycle of the glacier dammed lake. See an article in the book “INTERACT: stories of Arctic science” [5, p. 42] for a short description of the project. The seismic monitoring network at the outlet glacier of the A.P.Olsen ice cap consisting of five seismic and global navigation satellite system (GNSS) stations on the glacier and one GNSS base station at the glacier front. During our field work we had to dig many vertical, 1 to 2 meter deep snow-pits to reach the ice of the glacier. While standing in one of the holes I suddenly realized, that there was absolute silence. I have never experienced something like that in an open, natural environment. Usually if you are in a place where you think it’s very quiet, there is still some sound to hear from either a natural or an anthropogenic source. But that time in Greenland there was nothing to hear, no wind blowing, no water rippling, no rustling from vegetation, no animals, no man-made sound, even no airplanes - nothing. This made me think about all the possible sound sources still present but which we just can’t hear. As a seismologist, I knew, that the ground below me is filled with acoustic waves. Most of these waves have either too weak amplitudes and/or too low frequencies to be heard. What soundscape would be created by all these seismic waves? There already have been some people searching for the sound of seismic recordings. See seismicsoundslab, Beneath and Beyound: Seismic Sounds or SeismicSounds on Soundcloud for some examples. One common approach is to speed up the recorded seismograms to transform the signal to the audible frequency range. This preserves the characteristics of the frequency spectrum but the temporal behaviour is lost. Another method is pitch-shifting the seismic recordings to the audible range using a phase vocoder or granular synthesis. Usually a shift of several octaves of a low-frequency signal is required, which introduces computational artefacts altering the sound significantly [5]. Nevertheless these effects can be integral parts of the sound design or composition. Besides audification of the seismograms, parameter mapping is a widely used method for translating ground motion into sound (e.g. Fault Trace). With this method, characteristic features of the source data are mapped to features describing a sound (e.g. pitch, loudness, tone, …). The dataset recorded on the Greenland glacier spans 6 months from May 2012 to October 2012. A standard procedure when analyzing the seismic data is to compute a spectrogram and the probability power spectral density of the recorded data [5]. This gives a good overview of the general behaviour of the ambient seismic noise and periods with changes in the frequency or amplitude characteristics can be easily identified. It also provides a good temporal compression without loosing significant information and large datasets can be screened very fast for phases of special interest. Spectrogram of one week of seismic data recorded at station AP01. On the left, the temporal average of the spectrogram is plotted with the standard seismic noise models (grey lines) as a reference. The spectrogram shown above highlights the strength of these long-term spectrograms. Immediately several patterns can be seen. The two spikes right after the hours 60 and 84 with large energy down to very low frequencies, mark two strong earthquakes (Mw = 6.6 and Mb = 5.3) with an origin close to the Jan Mayen island. Several subsequent similar spikes, but not with that strong low frequency content mark aftershocks of the Jan Mayen main shock. The transition of the noise above 4 Hz to a diurnal pattern can be seen as well. A closer look into the seismograms shows, that this noise is comprised by many short icequakes occurring at short intervals (&lt; several seconds). This immediately leads to the question: “What is noise?”. Following Scales and Snieder [5], noise is that part of data, that we try not to explain. This very subjective approach is also reflected in the diurnal pattern described above, where the distinction between signal and noise depends on the observational period. The detailed investigation of the ambient seismic noise lead to three questions, that I’m trying to explore in the acoustic domain using sound-design and musical methods: How does temporal resolution affect the perception of noise, when turns signal into noise and when does noise transform into rhythm? My starting point is the sonification of the spectrograms to create a sound texture [5] representing ambient seismic noise. I’m using my custom written software psysmon for data analysis and preprocessing, custom Python scripts for data preparation and SuperCollider for the sonification. My first sonification approach consists of the creation of oscillator banks based on the peak frequencies of the power spectral density and a shaping of white noise using the power spectral density. The temporal evolution is created by traversing the power spectral densities of the spectrogram. Each seismic station is sonified individually and spread across the stereo field. Below you find the sonification of four days of the GlacioBurst dataset. The image related to each track shows the power spectral density of station AP01 of one week. The time-span used for the sonification is highlighted. The selected examples show characteristic features of the ambient seismic noise conditions at the A.P.Olsen ice cap outlet glacier and some outstanding events. I recommend using headphones for listening. DOY 125 Stefan Mertl Glacioburst Sounds This is a quiet day in the beginning of May. The seismic activity of the glacier is low. &lt;/source&gt; Your browser doesn't support the audio player. DOY 125 Stefan Mertl DOY 153 Stefan Mertl DOY 219 Stefan Mertl DOY 243 Stefan Mertl m-aar Radio The sonification of the complete dataset is available as an infinite loop audio stream at m-aar Radio. Thanks The GlacioBurst project was supported by https://seis-uk.le.ac.uk/ providing the seismic equipment and the INTERACT project, the Polarvision project (Austrian Federal Ministry of Science and Research, GZ: 37.556/0002-II/4/2010) covering the travel costs and Zackenberg Research Station with a warm welcome and logistic infrastructure. References T. V. Callaghan, H. Savela, Seventh Framework Programme (European Commission), DCE - Nationalt Center for Miljø og Energi, and Interact (Organization), INTERACT: stories of Arctic science. 2017. https://eu-interact.org/publication/1349/ @book{callaghan_interact_2017, title = {INTERACT: stories of Arctic science}, isbn = {978-87-93129-11-5}, url = {https://eu-interact.org/publication/1349/}, shorttitle = {{INTERACT}}, pagetotal = {184}, author = {Callaghan, T. V and Savela, Hannele and {Seventh Framework Programme (European Commission)} and {DCE - Nationalt Center for Miljø og Energi} and {Interact (Organization)}}, year = {2017}, langid = {english}, note = {OCLC: 1057268595}, file = {Callaghan et al. - 2017 - INTERACT stories of Arctic science.pdf:/home/stefan/01_gtd/05_dokumente/bibliothek/zotero/storage/Q55CLX88/Callaghan et al. - 2017 - INTERACT stories of Arctic science.pdf:application/pdf} } R. McGee and D. Rogers, “Musification of Seismic Data,” in Proceedings of the 22nd International Conference on Auditory Display - ICAD 2016, 2016-07, pp. 201–204. http://doi.org/10.21785/icad2016.021 http://hdl.handle.net/1853/56569 @inproceedings{mcgee_musification_2016, location = {Canberra, Australia}, title = {Musification of Seismic Data}, isbn = {978-0-9670904-3-6}, url = {http://hdl.handle.net/1853/56569}, doi = {10.21785/icad2016.021}, eventtitle = {The 22nd International Conference on Auditory Display}, pages = {201--204}, booktitle = {Proceedings of the 22nd International Conference on Auditory Display - {ICAD} 2016}, publisher = {The International Community for Auditory Display}, author = {McGee, Ryan and Rogers, David}, urldate = {2019-10-04}, year = {2016-07}, langid = {english}, file = {McGee und Rogers - 2016 - Musification of Seismic Data.pdf:/home/stefan/01_gtd/05_dokumente/bibliothek/zotero/storage/XRTVXJTR/McGee und Rogers - 2016 - Musification of Seismic Data.pdf:application/pdf} } D. E. McNamara and R. P. Buland, “Ambient Noise Levels in the Continental United States,” Bulletin of the Seismological Society of America, vol. 94, no. 4, pp. 1517–1527, 2004. http://doi.org/10.1785/012003001 http://www.bssaonline.org/content/94/4/1517.abstract @article{mcnamara_ambient_2004, title = {Ambient Noise Levels in the Continental United States}, volume = {94}, url = {http://www.bssaonline.org/content/94/4/1517.abstract}, doi = {10.1785/012003001}, pages = {1517--1527}, number = {4}, journaltitle = {Bulletin of the Seismological Society of America}, author = {McNamara, Daniel E. and Buland, Raymond P.}, year = {2004}, file = {mcnamara_buland_2004_ambient_noise_levels_in_the_continental_united_states.pdf:/home/stefan/01_gtd/05_dokumente/bibliothek/zotero/storage/TXUJREZB/mcnamara_buland_2004_ambient_noise_levels_in_the_continental_united_states.pdf:application/pdf} } J. A. Scales and R. Snieder, “What is noise?,” Geophysics, vol. 63, no. 4, pp. 1122–1124, 1998. @article{scales_what_1998, title = {What is noise?}, volume = {63}, pages = {1122--1124}, number = {4}, journaltitle = {Geophysics}, author = {Scales, John A. and Snieder, Roel}, year = {1998}, file = {scales_snieder_1998_what_is_noise.pdf:/home/stefan/01_gtd/05_dokumente/bibliothek/zotero/storage/6KA5UGA4/scales_snieder_1998_what_is_noise.pdf:application/pdf} } D. Schwarz, “State of the Art in Sound Texture Synthesis,” in Proc. of the 14 th Int. Conference on Digital Audio Effects (DAFx-11), 2011, p. 12. @inproceedings{schwarz_state_2011, location = {Paris}, title = {State of the Art in Sound Texture Synthesis}, eventtitle = {14 th Int. Conference on Digital Audio Effects ({DAFx}-11)}, pages = {12}, booktitle = {Proc. of the 14 th Int. Conference on Digital Audio Effects ({DAFx}-11)}, author = {Schwarz, Diemo}, year = {2011}, langid = {english}, file = {Schwarz - 2011 - State of the Art in Sound Texture Synthesis.pdf:/home/stefan/01_gtd/05_dokumente/bibliothek/zotero/storage/CLWCX8YP/Schwarz - 2011 - State of the Art in Sound Texture Synthesis.pdf:application/pdf} }]]></summary><media:thumbnail xmlns:media="http://search.yahoo.com/mrss/" url="https://www.mertl-research.at/%7B%22homepage%22=%3E%22snow_landscape.jpg%22,%20%22featured%22=%3E%22frontpage.jpg%22%7D" /><media:content medium="image" url="https://www.mertl-research.at/%7B%22homepage%22=%3E%22snow_landscape.jpg%22,%20%22featured%22=%3E%22frontpage.jpg%22%7D" xmlns:media="http://search.yahoo.com/mrss/" /></entry><entry xml:lang="de"><title type="html">Observe Restructured</title><link href="https://www.mertl-research.at/flickering_in_the_anthropocene/observe_restructured/" rel="alternate" type="text/html" title="Observe Restructured" /><published>2019-08-29T00:00:00+02:00</published><updated>2019-08-29T00:00:00+02:00</updated><id>https://www.mertl-research.at/flickering_in_the_anthropocene/observe_restructured</id><content type="html" xml:base="https://www.mertl-research.at/flickering_in_the_anthropocene/observe_restructured/"><![CDATA[<p>Auf meiner Fotografie Subseite <a href="http://observe.mertl-research.at" target="blank">observe.mertl-research.at</a> präsentiere ich die Ergebnisse meiner künstlerischen Arbeiten zu Themen wie urbane Entwicklung, die Erde an sich und die menschliche Beziehung zu ihr.</p>

<div style="padding-bottom: 1.25rem; text-align: center;">
<a href="/images/posts/2019/2019-08-29/observe_view_01.jpg" data-featherlight="image" caption="Ansicht des Projekts Super Sucking City.">
<img src="/images/posts/2019/2019-08-29/observe_view_01.jpg" alt="Ansicht des Projekts Super Sucking City." />
</a>


<figcaption class="center-caption">
    Ansicht des Projekts Super Sucking City.
</figcaption>


</div>

<p>Ich habe einige Energie in das Redesign und die Refaktorisierung des Quellcodes gesteckt. Am wichtigsten war die Vermeidung der Verwendung unterschiedlicher Frameworks für das Seitenlayout. Nun verwende ich das <a href="https://foundation.zurb.com/" target="blank">foundation framework</a> für das Hauptlayout, <a href="https://masonry.desandro.com/" target="blank">masonry</a> für aufwendigere Grid-Layouts und maßgeschneiderten Javascript Code für manche Dinge, die mit den Frameworks nicht bewerkstelligt werden können. Alles ist in eine statische HTML Seite eingebaut, die ich mit <a href="https://jekyllrb.com/">Jekyll</a> erstelle.</p>

<p>Mit diesem Setup habe ich die volle Kontrolle über das Design, einen überschaubaren Quellcode, der mit einem Versionskontrollsystem verwaltet werden kann und eine verbesserte Sicherheit auf dem Webserver.</p>

<div style="padding-bottom: 1.25rem; text-align: center;">
<a href="/images/posts/2019/2019-08-29/observe_view_02.jpg" data-featherlight="image" caption="Ansicht des Projekts Zu Tode gelangweilt.">
<img src="/images/posts/2019/2019-08-29/observe_view_02.jpg" alt="Ansicht des Projekts Zu Tode gelangweilt." />
</a>


<figcaption class="center-caption">
    Ansicht des Projekts Zu Tode gelangweilt.
</figcaption>


</div>

<div style="padding-bottom: 1.25rem; text-align: center;">
<a href="/images/posts/2019/2019-08-29/observe_view_03.jpg" data-featherlight="image" caption="Ansicht des Projekts Urbane Spielplätze.">
<img src="/images/posts/2019/2019-08-29/observe_view_03.jpg" alt="Ansicht des Projekts Urbane Spielplätze." />
</a>


<figcaption class="center-caption">
    Ansicht des Projekts Urbane Spielplätze.
</figcaption>


</div>]]></content><author><name>Stefan Mertl</name></author><category term="flickering_in_the_anthropocene" /><summary type="html"><![CDATA[Auf meiner Fotografie Subseite observe.mertl-research.at präsentiere ich die Ergebnisse meiner künstlerischen Arbeiten zu Themen wie urbane Entwicklung, die Erde an sich und die menschliche Beziehung zu ihr. Ansicht des Projekts Super Sucking City. Ich habe einige Energie in das Redesign und die Refaktorisierung des Quellcodes gesteckt. Am wichtigsten war die Vermeidung der Verwendung unterschiedlicher Frameworks für das Seitenlayout. Nun verwende ich das foundation framework für das Hauptlayout, masonry für aufwendigere Grid-Layouts und maßgeschneiderten Javascript Code für manche Dinge, die mit den Frameworks nicht bewerkstelligt werden können. Alles ist in eine statische HTML Seite eingebaut, die ich mit Jekyll erstelle. Mit diesem Setup habe ich die volle Kontrolle über das Design, einen überschaubaren Quellcode, der mit einem Versionskontrollsystem verwaltet werden kann und eine verbesserte Sicherheit auf dem Webserver. Ansicht des Projekts Zu Tode gelangweilt. Ansicht des Projekts Urbane Spielplätze.]]></summary><media:thumbnail xmlns:media="http://search.yahoo.com/mrss/" url="https://www.mertl-research.at/%7B%22homepage%22=%3E%22featured_image.jpg%22,%20%22featured%22=%3E%22featured_image.jpg%22%7D" /><media:content medium="image" url="https://www.mertl-research.at/%7B%22homepage%22=%3E%22featured_image.jpg%22,%20%22featured%22=%3E%22featured_image.jpg%22%7D" xmlns:media="http://search.yahoo.com/mrss/" /></entry></feed>