Sonification of a glacier lake outburst flood.
Listen to Seismic Noise
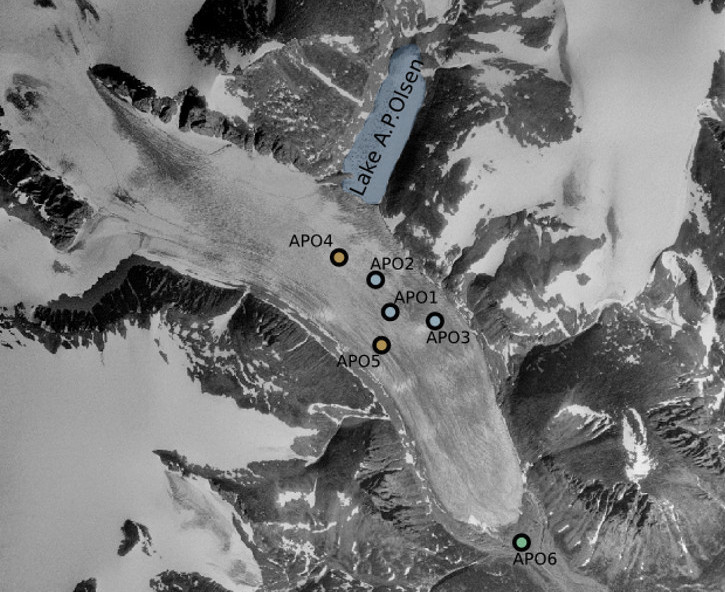
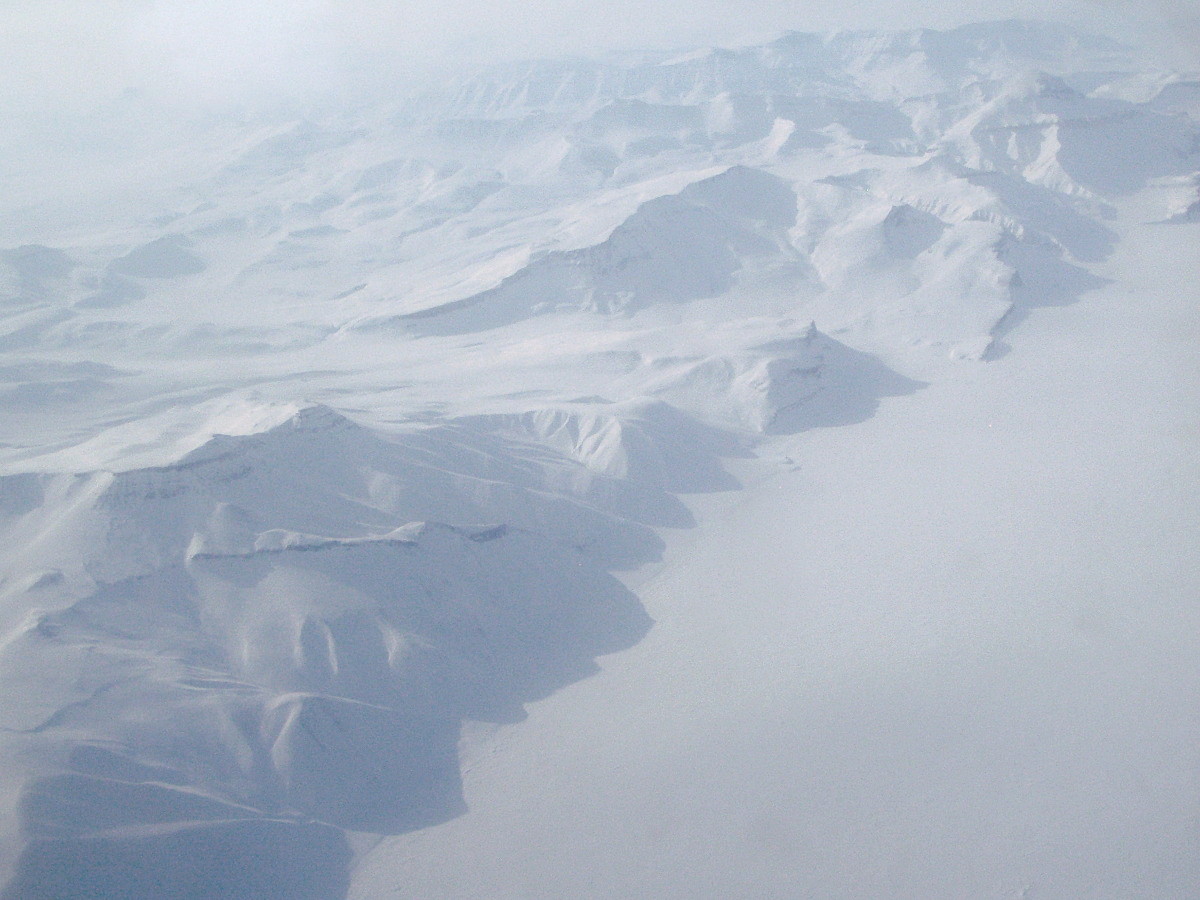
Back in 2012, I took part in a research project called GlacioBurst to monitor a glacier lake outburst flood at an outlet glacier of the A.P.Olsen ice cap in Greenland. A valley blocked by the glacier fills up with water during the melting period. The growing lake in the valley (we named it Lake A.P. Olsen) is suddenly emptied within some hours in a more or less yearly interval, creating a glacier lake outburst flood downstream. The outburst flood usually happens sometime in autumn, although variations from this regularity with floodings in summer or spring have also been observed. We have installed a seismic- and deformation monitoring network on the glacier to capture the complete fill- and drain cycle of the glacier dammed lake. See an article in the book “INTERACT: stories of Arctic science” [1, p. 42] for a short description of the project.
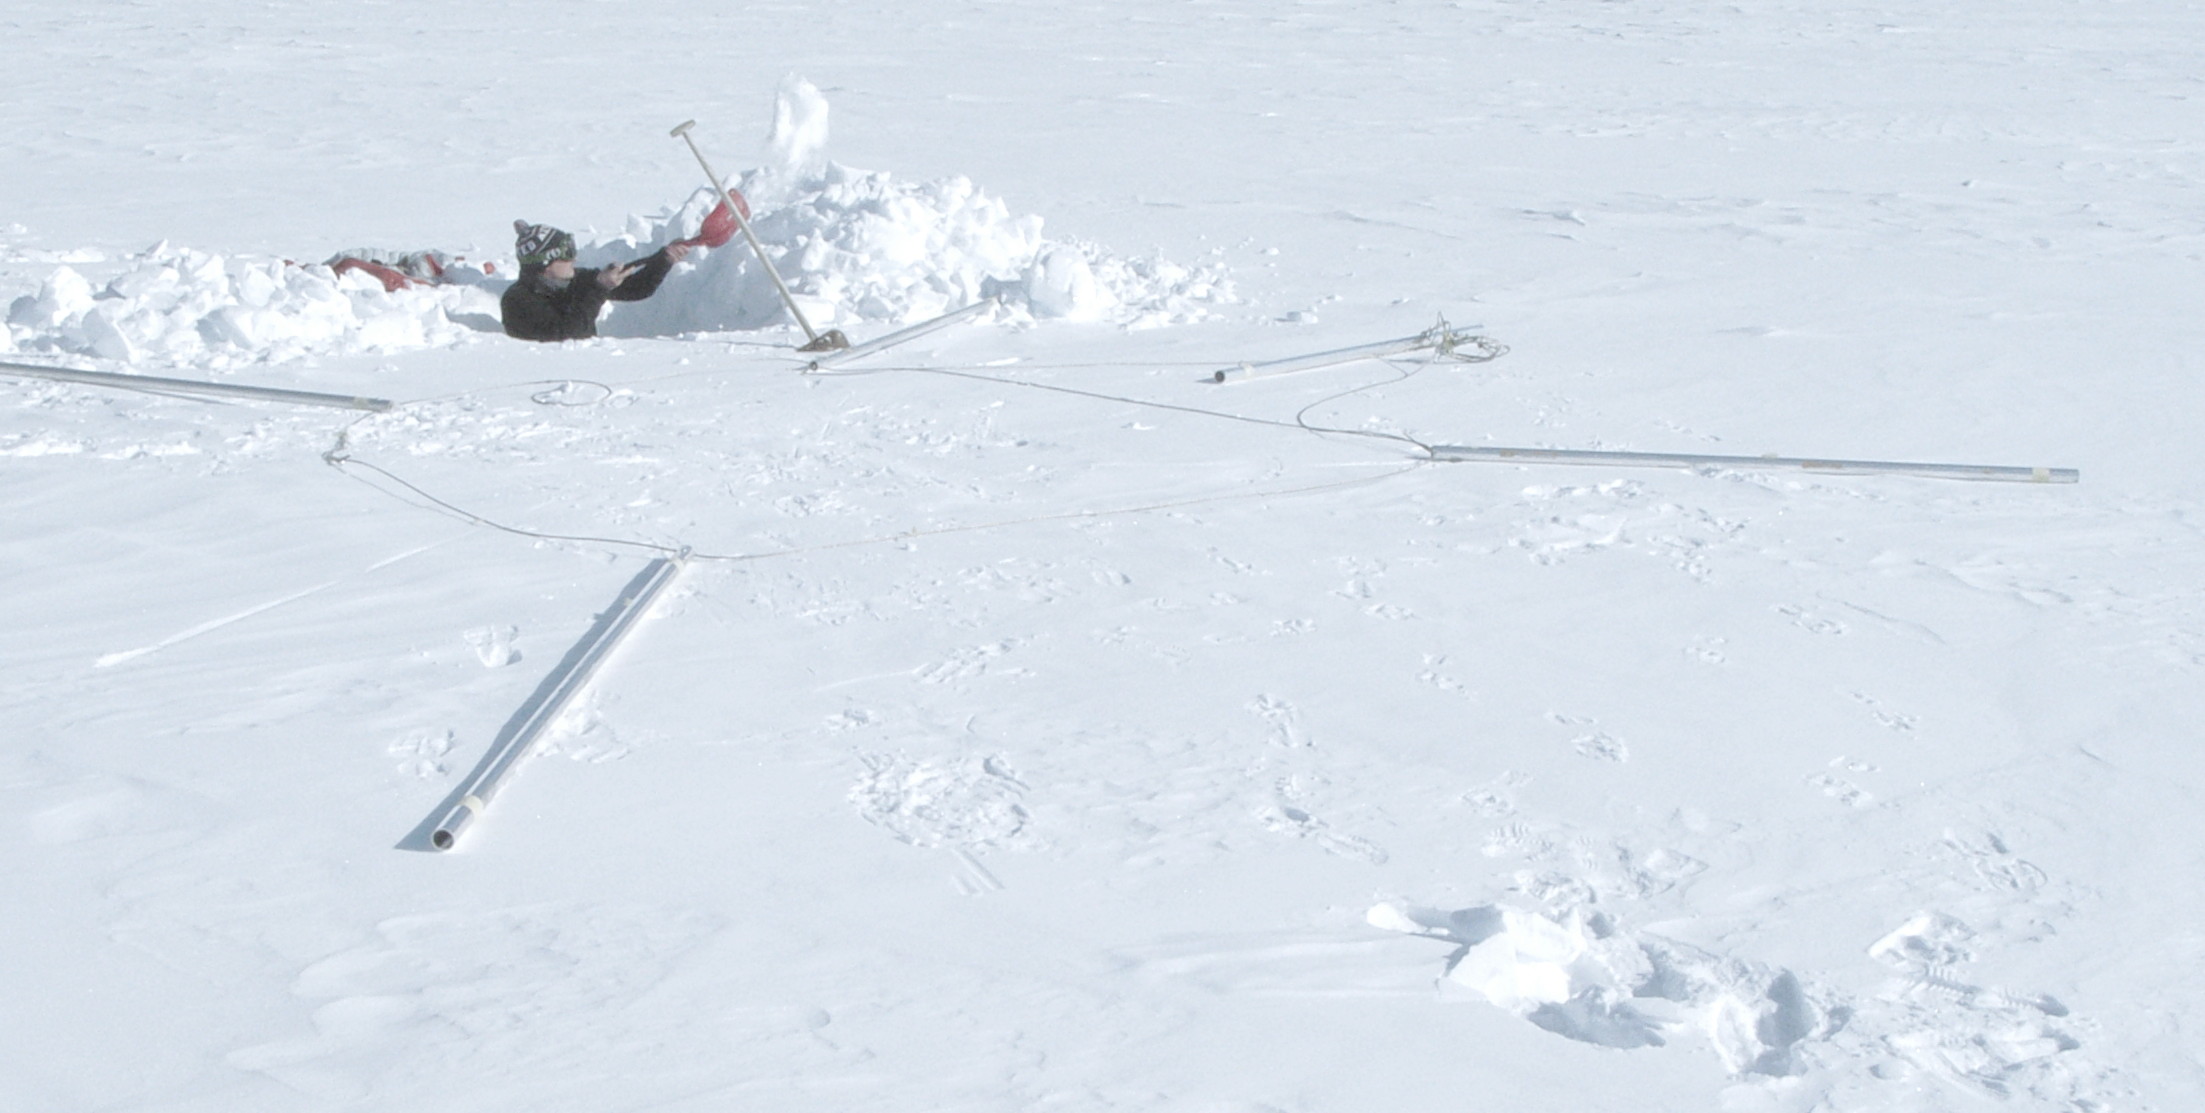
During our field work we had to dig many vertical, 1 to 2 meter deep snow-pits to reach the ice of the glacier. While standing in one of the holes I suddenly realized, that there was absolute silence. I have never experienced something like that in an open, natural environment. Usually if you are in a place where you think it’s very quiet, there is still some sound to hear from either a natural or an anthropogenic source. But that time in Greenland there was nothing to hear, no wind blowing, no water rippling, no rustling from vegetation, no animals, no man-made sound, even no airplanes - nothing.
This made me think about all the possible sound sources still present but which we just can’t hear. As a seismologist, I knew, that the ground below me is filled with acoustic waves. Most of these waves have either too weak amplitudes and/or too low frequencies to be heard. What soundscape would be created by all these seismic waves?
There already have been some people searching for the sound of seismic recordings. See seismicsoundslab, Beneath and Beyound: Seismic Sounds or SeismicSounds on Soundcloud for some examples. One common approach is to speed up the recorded seismograms to transform the signal to the audible frequency range. This preserves the characteristics of the frequency spectrum but the temporal behaviour is lost. Another method is pitch-shifting the seismic recordings to the audible range using a phase vocoder or granular synthesis. Usually a shift of several octaves of a low-frequency signal is required, which introduces computational artefacts altering the sound significantly [2]. Nevertheless these effects can be integral parts of the sound design or composition. Besides audification of the seismograms, parameter mapping is a widely used method for translating ground motion into sound (e.g. Fault Trace). With this method, characteristic features of the source data are mapped to features describing a sound (e.g. pitch, loudness, tone, …).
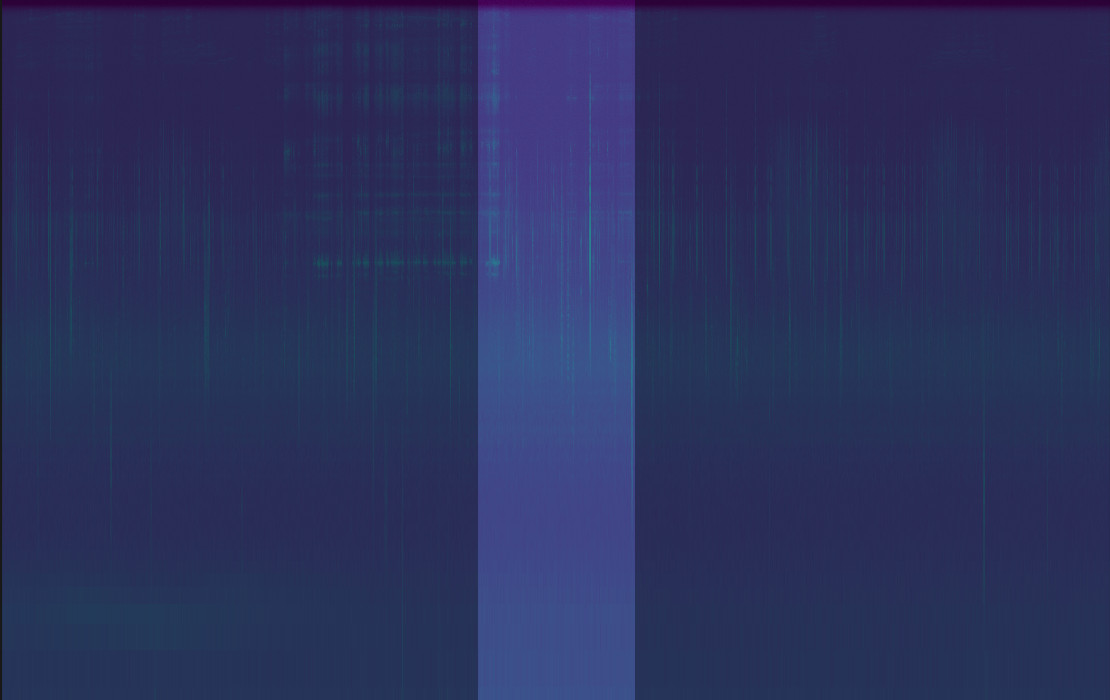
The dataset recorded on the Greenland glacier spans 6 months from May 2012 to October 2012. A standard procedure when analyzing the seismic data is to compute a spectrogram and the probability power spectral density of the recorded data [3]. This gives a good overview of the general behaviour of the ambient seismic noise and periods with changes in the frequency or amplitude characteristics can be easily identified. It also provides a good temporal compression without loosing significant information and large datasets can be screened very fast for phases of special interest.
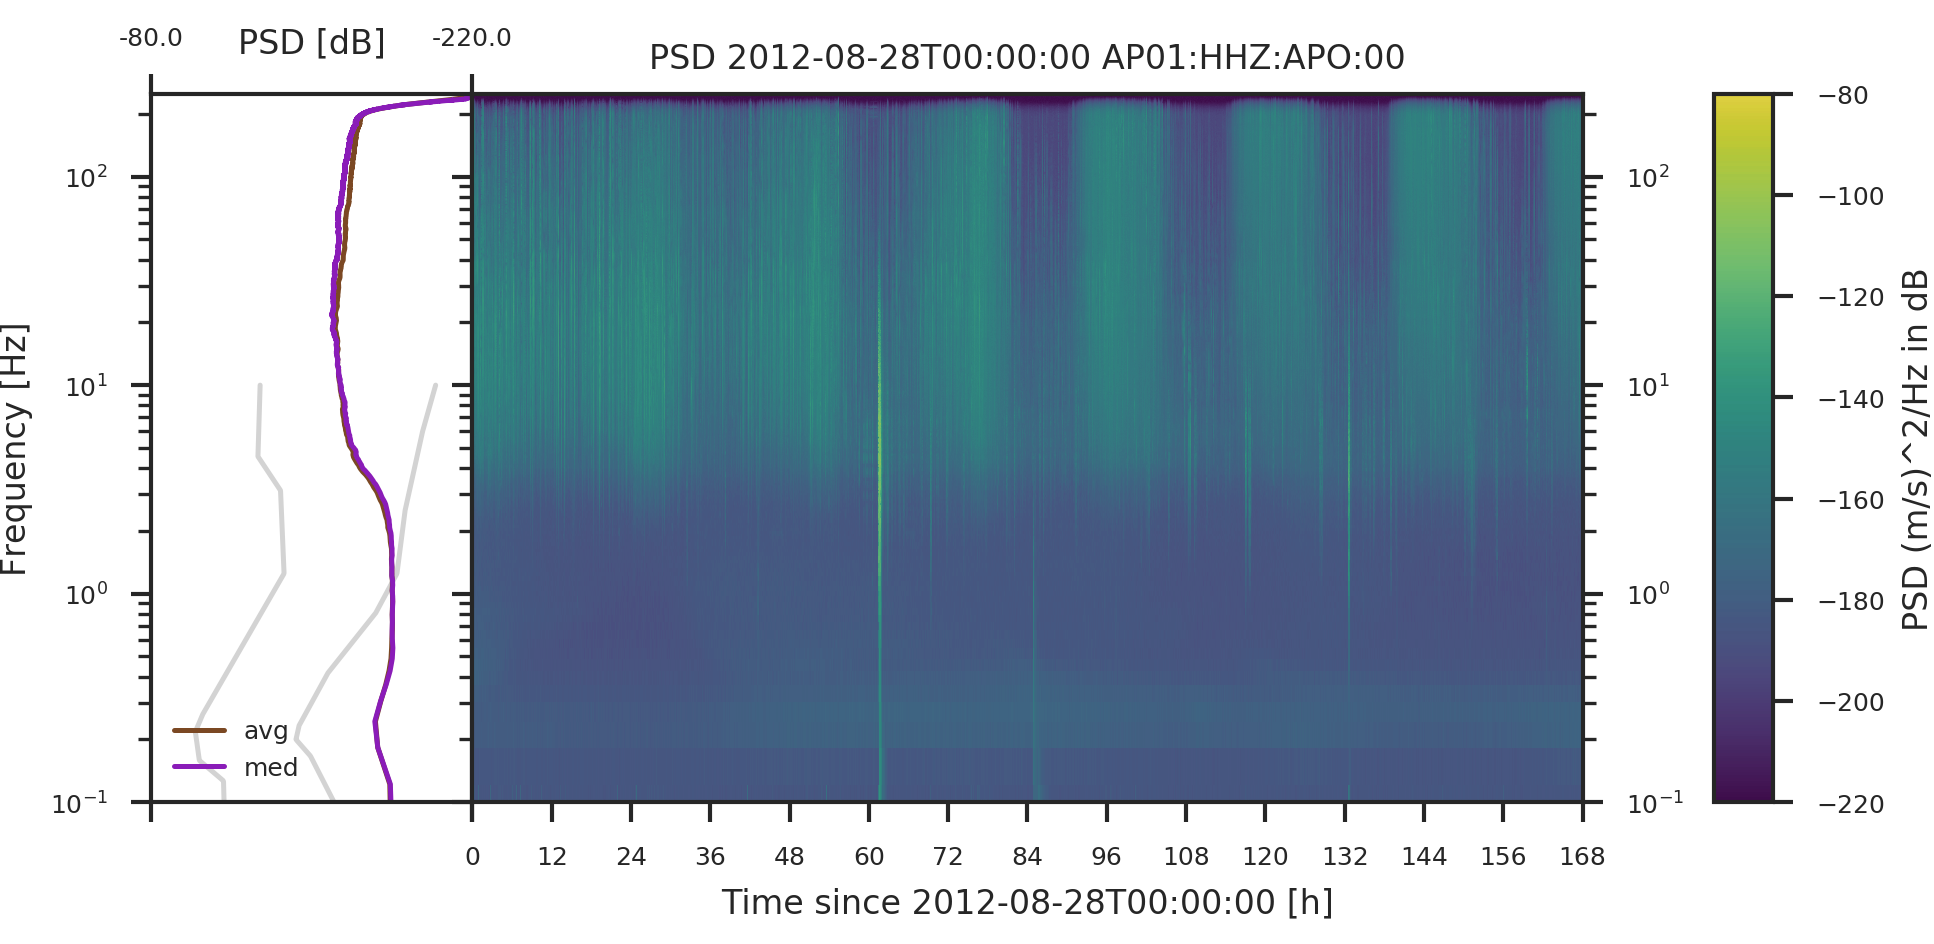
The spectrogram shown above highlights the strength of these long-term spectrograms. Immediately several patterns can be seen. The two spikes right after the hours 60 and 84 with large energy down to very low frequencies, mark two strong earthquakes (Mw = 6.6 and Mb = 5.3) with an origin close to the Jan Mayen island. Several subsequent similar spikes, but not with that strong low frequency content mark aftershocks of the Jan Mayen main shock. The transition of the noise above 4 Hz to a diurnal pattern can be seen as well. A closer look into the seismograms shows, that this noise is comprised by many short icequakes occurring at short intervals (< several seconds). This immediately leads to the question: “What is noise?”. Following Scales and Snieder [4], noise is that part of data, that we try not to explain. This very subjective approach is also reflected in the diurnal pattern described above, where the distinction between signal and noise depends on the observational period.
The detailed investigation of the ambient seismic noise lead to three questions, that I’m trying to explore in the acoustic domain using sound-design and musical methods: How does temporal resolution affect the perception of noise, when turns signal into noise and when does noise transform into rhythm?
My starting point is the sonification of the spectrograms to create a sound texture [5] representing ambient seismic noise. I’m using my custom written software psysmon for data analysis and preprocessing, custom Python scripts for data preparation and SuperCollider for the sonification.
My first sonification approach consists of the creation of oscillator banks based on the peak frequencies of the power spectral density and a shaping of white noise using the power spectral density. The temporal evolution is created by traversing the power spectral densities of the spectrogram. Each seismic station is sonified individually and spread across the stereo field.
Below you find the sonification of four days of the GlacioBurst dataset. The image related to each track shows the power spectral density of station AP01 of one week. The time-span used for the sonification is highlighted. The selected examples show characteristic features of the ambient seismic noise conditions at the A.P.Olsen ice cap outlet glacier and some outstanding events.
I recommend using headphones for listening.

m-aar Radio
The sonification of the complete dataset is available as an infinite loop audio stream at m-aar Radio.
Thanks
The GlacioBurst project was supported by https://seis-uk.le.ac.uk/ providing the seismic equipment and the INTERACT project, the Polarvision project (Austrian Federal Ministry of Science and Research, GZ: 37.556/0002-II/4/2010) covering the travel costs and Zackenberg Research Station with a warm welcome and logistic infrastructure.
References
- T. V. Callaghan, H. Savela, Seventh Framework Programme (European Commission), DCE - Nationalt Center for Miljø og Energi, and Interact (Organization), INTERACT: stories of Arctic science. 2017.https://eu-interact.org/publication/1349/
- R. McGee and D. Rogers, “Musification of Seismic Data,” in Proceedings of the 22nd International Conference on Auditory Display - ICAD 2016, 2016-07, pp. 201–204.http://doi.org/10.21785/icad2016.021 http://hdl.handle.net/1853/56569
- D. E. McNamara and R. P. Buland, “Ambient Noise Levels in the Continental United States,” Bulletin of the Seismological Society of America, vol. 94, no. 4, pp. 1517–1527, 2004.http://doi.org/10.1785/012003001 http://www.bssaonline.org/content/94/4/1517.abstract
- J. A. Scales and R. Snieder, “What is noise?,” Geophysics, vol. 63, no. 4, pp. 1122–1124, 1998.
- D. Schwarz, “State of the Art in Sound Texture Synthesis,” in Proc. of the 14 th Int. Conference on Digital Audio Effects (DAFx-11), 2011, p. 12.
SEISMOGROOVEBOX